Analyzing the SPMC Results
After the simulation is complete, you visualize the results.
-
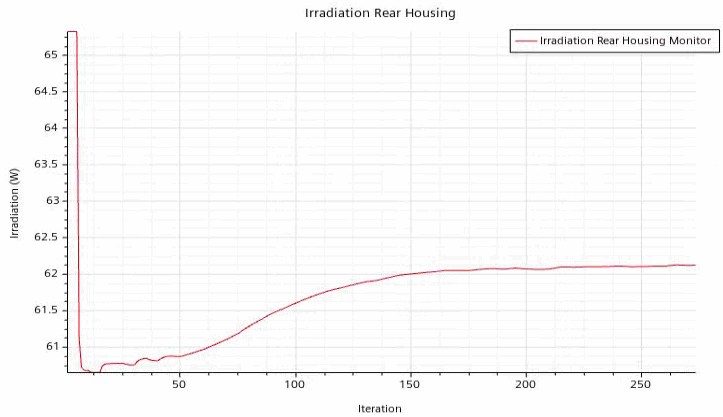
In the Graphics window, click through the Min/Max Temperature Plot and the Irradiation Rear Housing Plot tabs.
The following plots display the results after the run:


From both plots you can see that the solution is converged.
To examine the scenes:
-
Click through the Direct Solar Irradiation,
Reflector Temperature, Streamlines, and Lens
Temperature scenes.
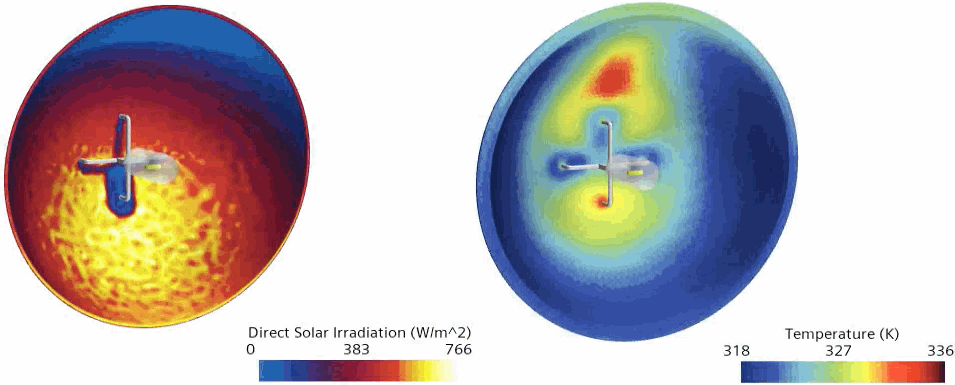
The following screenshots show the direct solar irradiation and the temperature hotspots on the reflector of the headlamp:

The direct solar irradiation reaches its maximum value in the bottom area of the reflector. However, due to natural convection inside the headlamp, a temperature hotspot appears above the halogen bulb.
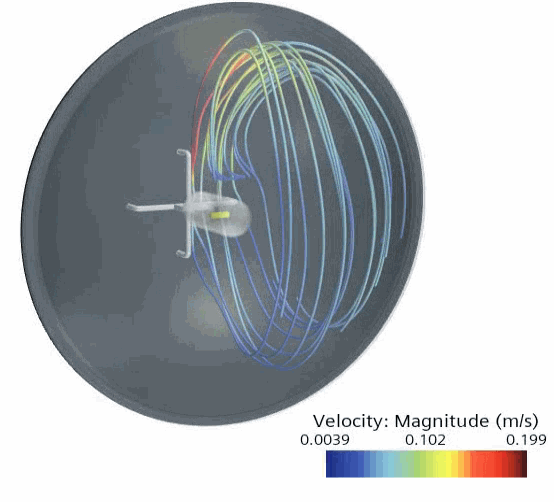
The Streamlines scene shows the streamlines in the headlamp:

The Lens Temperature scene shows the temperature on the lens of the headlamp:

The temperature is highest around the edges of the lens.
For the next part of the tutorial, to ensure that you compare like with
like when you analyze the differences between the SPMC and combined SPMC/VPMC
simulations, you freeze the bounds of the temperature scales in the Lens
Temperature and Reflector Temperature scenes
before remeshing the headlamp.
- Multi-edit the Lens Temperature and Reflector Temperature scenes.
-
In the Multiple Objects dialog, expand the node and set the following properties:
Property Setting Auto Range Off Clip Off - Save the simulation.