Running the Simulation and Visualizing the Results
To make sure the waves come into contact with the boat hull and the simulation converges, you specify a large physical time, relative to the time-step. You can then initialize and run the simulation.
- Select the node and set Maximum Physical Time to 30.0 s.
- Select the Maximum Inner Iterations node and set Maximum Inner Iterations to 5.
- Select Maximum Steps and deactivate Enabled.
-
To initialize the solution, click
 (Initialize).
-
To run the simulation, click
 (Run).
Once the simulation has completed you can view the solution.
 - Open the scene.
-
Click the
 (Save-Store-Current Views) and select to orient the view as shown:

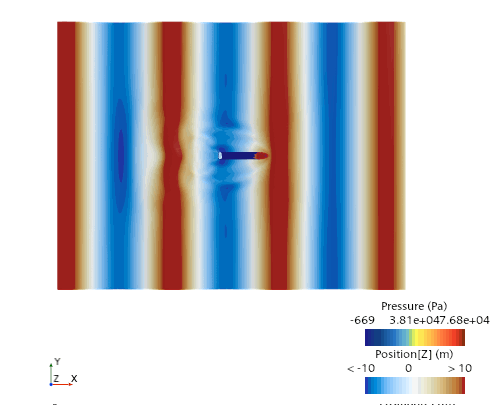
The IsoSurfaceWaves scene shows the water displacement due to the hull and waves. The amplitudes are represented by the red and blue contours. -
Open the 6-DOF Body Force X Monitor Plot,
6-DOF Body Orientation X Monitor Plot and the
6-DOF Body Orientation Y Monitor Plot.

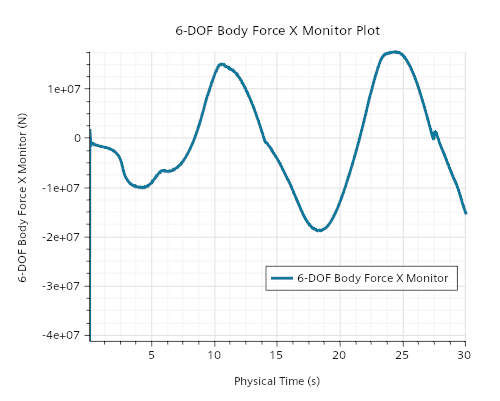
The 6-DOF Body Force X Monitor Plot shows the body forces on the hull in the X axis. The maximum force exerted on the hull is at the peak of the waves, and the minimum force exerted on the hull is at the trough of the waves.
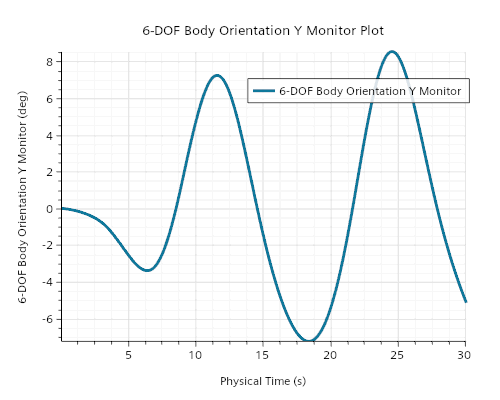
The 6-DOF Body Orientation Y Monitor Plot shows the pitch of the hull, the change in pitch primarily results from the oncoming waves, which also attribute to the relationship shown in the 6-DOF Body Force X Monitor Plot.