Post-Processing the Design Study
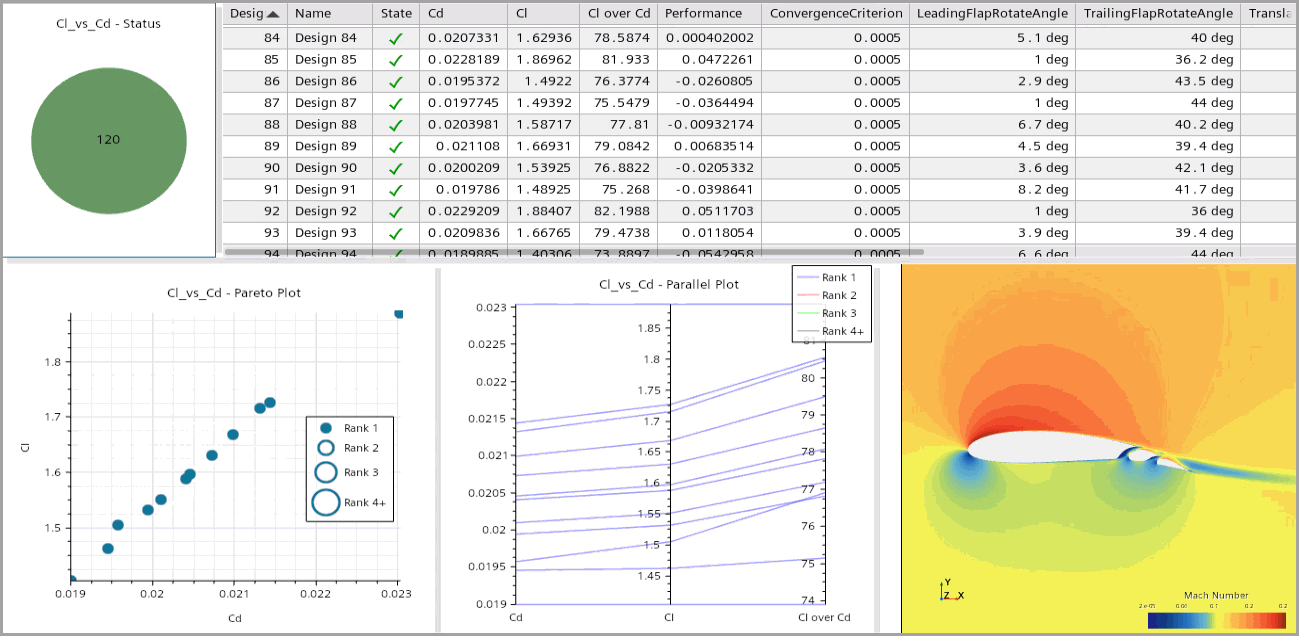
Once the study starts to run, Design Manager arranges the relevant post-processing elements in a dashboard. The post-processing elements that appear in the dashboard depend on the study type.
- Design Output Table
- Pie Chart based on the design status.
- Pareto Plot of Cl and Cd in all the Pareto ranks. Rank 1 determines the Pareto front of the competing objectives (maximum Cl, minimum Cd).
- Parallel Plot of the responses Cl, Cd, and Cl over Cd.
- Snapshot of the first scene—MachNumberScalar.
The results that you obtain in your optimization study can differ from the results displayed below. When performing optimization studies, Design Manager uses a random seed point and assesses each design in a random manner, steering the solution towards the optimized design. Results that are displayed below are for illustrative purposes.

The default parallel plot provides the correlation of the
design responses in the design space. To display the sampled distribution and
correlation of the design input parameters, modify the parallel coordinates plot as
follows:
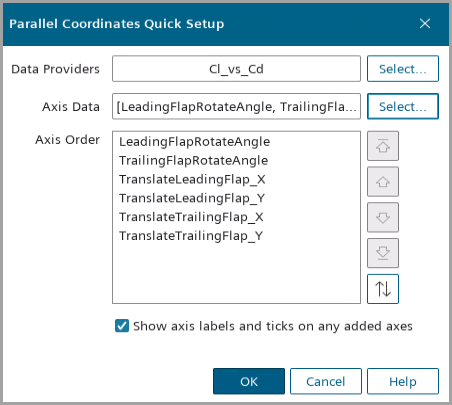
- Right-click the node and select Quick Setup.
- In the Data Set Quick Setup dialog, click Select... next to the Axis Data option.
-
In the dialog, deselect the Responses and select all the
trailing and leading flap parameters under the Input
Parameters node.

- Click OK.
By default, the Parallel Coordinates plot only includes the
designs within the last Pareto Cycle. To include other cycles within the
plot:
- Select the node.
-
Select the Cycle property and
click
 (Custom Editor).
- In the dialog, right-click the empty space and click Select All.
-
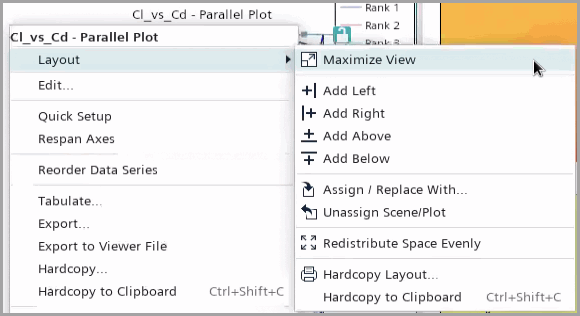
To maximize the parallel coordinates plot, right-click the Cl_vs_Cd
- Parallel Plot on the dashboard and select .

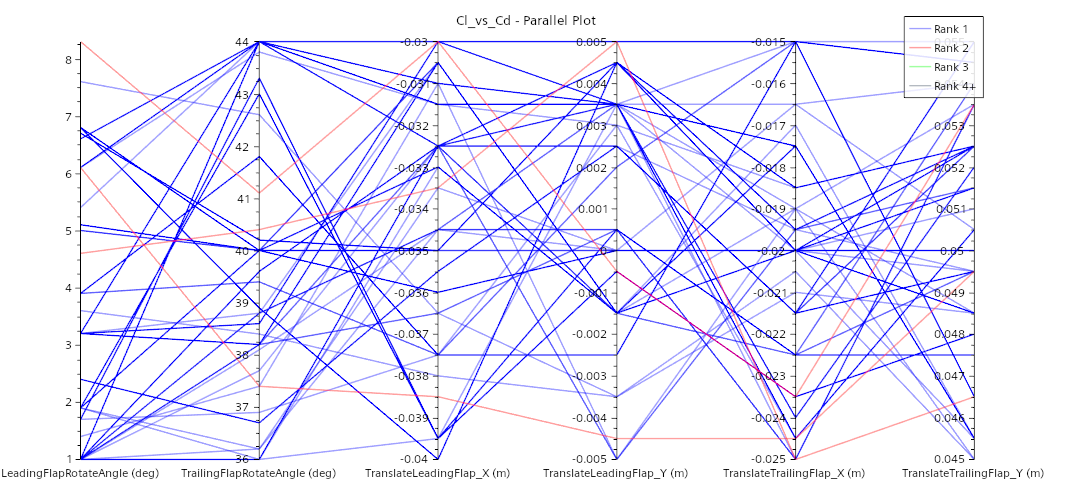
Design Manager opens the parallel coordinates plot to show the parameter sampling during the entire Pareto optimization process:
- Save the Design Manager Project.