Constructing a Custom Report of Objects
You can generate a summary of the parts of the simulation that are of interest.
Within the Summaries node, you can create one or more summary objects from which you generate simulation object reports. You populate the summary objects with representations of simulation objects, and then move those representations around to achieve the layout you require.
To create and configure a simulation summary:
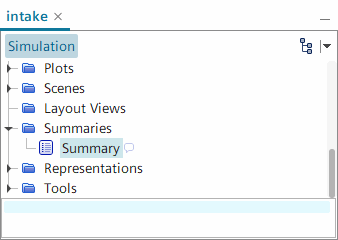
- Right-click the Summaries node and select New. A node with the default name Summary appears in the object tree.

- To specify objects for the summary, select objects using one of the following techniques:
- Right-click the summary node and select Choose Descendants. In the object selector dialog, select the elements that you want included in the summary.
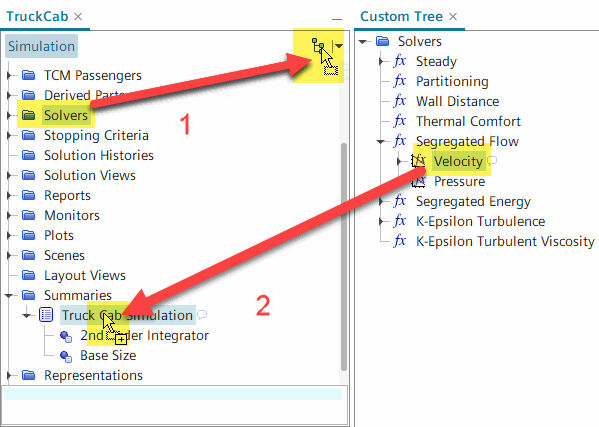
- Drag and drop objects from the object tree onto the summary node. If the object you are moving contains any child nodes, a dialog appears in which you choose which descendants to include along with the chosen object.
If you want to choose some objects from say, the Solvers node, you can first drag that node onto the Create Custom Tree button at the top-right of the object panel, and then drag objects from the custom tree back onto the summary node.

If you drag an object that is already represented in the sub-node hierarchy of that summary node, a dialog appears giving you the choice of adding the duplicate, replacing the sub-node that is already in the summary, or canceling the action.
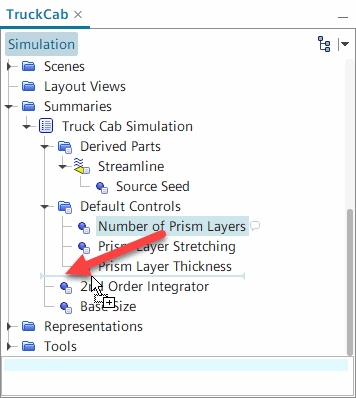
- To modify the ordering of objects, expand the summary node and move objects using drag-and-drop.

- To change the amount of information reported for an object, select its representation within the summary, and modify the following properties:
- Show Properties
- Include Expert
- Include Read-Only
- List Dependents
- Tags—for tagging the summary sub-nodes separately from their corresponding objects in the main simulation tree
- Generate Image—for scenes or plots only
- Generate Report—for reports only
- To remove selections from the summary, right-click the object within the summary node and select Delete. Alternatively, select the object and press
<Delete>. - For easy reference to multiple summaries, rename each summary node according to its content.
-
To generate and view a summary report, use either of the following techniques:
- Generate a display of the summary report within the Simcenter STAR-CCM+ workspace:
- Right-click the summary node and select Open Summary.
The summary report appears in the Graphics window.
- To have the summary report reflect any recent changes to the objects
listed in it, update it using any of the following techniques:
- To see changes reflected automatically in the summary report display, activate the Automatic Refresh property. You can do this at any point in the workflow, that is, before or after displaying a summary report.
- Click
 (Reload) at the top left of the summary report
display.
 - Right-click the summary node or inside the summary report display and select Reload.
- Right-click the summary node and select Open Summary.
- Generate external data that can be shared and viewed in a web browser:
- Right-click the summary node and select Create Output File.
- In the standard Save dialog, navigate to the preferred location, enter a name for the HTML file in the File Name text box, and click Save.
- To view the summary report, open the HTML file in the browser of your choice.
In addition to the HTML file itself, a folder is generated in the same location, and with the same base filename, as the HTML file. This folder contains associated files, including any images.
- Generate a display of the summary report within the Simcenter STAR-CCM+ workspace:
Extended Summary with Table of Report Values
You can append a summary of all your reports' values in a table at the end of the summary report. This option can be helpful when your simulation contains numerous reports.
- To append the summary of report values, right-click the node of the summary and select Add Tabular Summary.A new Tabular Summary node appears under the Summary node.
- If your simulation contains a large number of reports that can be grouped by categories, create additional tabular summary nodes and rename them according to each category of your reports.
- To specify which reports to include in the tabular summary, click
 (Custom Editor) in the Target Objects property of the Tabular Summary node.The next summary report that you generate includes a heading containing the name of your tabular summary node, ("Tabular Summary" by default) with a table of the names, values, and units of the selected report.
注 The report values provided by a tabular summary are the same as the monitor value for a given report, obtained by creating a monitor from the report of interest. - To add a column with the report types, activate the Show Object Type property of the Tabular Summary node.The next summary report includes a third column containing the types of the selected reports.