Visualizing the Solution
View the results of the simulation. You can view the velocity vectors on a cross-section through the fluid region as the solution develops.
To visualize the solution:
-
Right-click the Scenes node, and select .
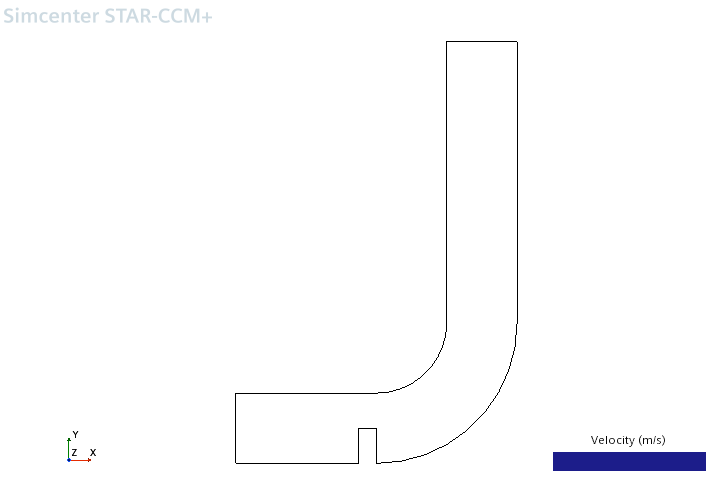
The Vector Scene 1 display appears.
Create a plane section part for display.
-
Right-click the Derived Parts node, and select .
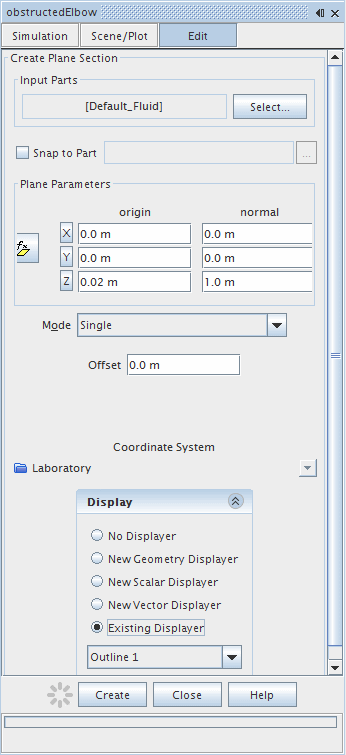
A new interactive in-place dialog, Create Plane Section, appears.
- In the Plane Parameters box, set the normal to (0,0,1) and the origin to (0,0,0.02).
-
In the Display box, select the radio button
Existing Displayer to show the plane section in the
current scene.
The completed dialog is shown below.

- Click Create to create the plane section.
-
Click Close in the Create Plane
Section dialog.
A node appears within the Derived Parts node, plane section.

The plane section part is displayed in the vector scene geometry. To display velocity vectors on the plane section, the part must also be added to the Vector 1 displayer.
- Select the node and set Parts to .
- Select the node and set Parts to .
The vector scene is now ready. No vectors appears in the scene until the run is started.

Create a scalar scene.
-
Right-click the Scenes node, and select .
The Scalar Scene 1 display appears.
To define the scalar scene:
- Select the new node and change the Contour Style to Smooth Filled.
- Select the node and set Parts to .
-
Right-click the scalar bar in the display. In the pop-up menu that appears, select .

- Save the simulation.