
本文描述在STAR CCM+中实现计算过程中判断监测物理量的值,并在监测值达到目标时停止计算。
前面提到在 Fluent 中监测物理量,并在物理量达到设定条件时终止计算的一些方法。STAR CCM+中也可以实现相同的操作。
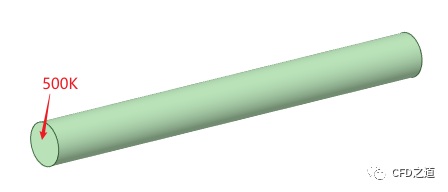
还是用相同的案例来描述此过程。如图所示的几何模型,直径20 mm,长度200 mm。左侧壁面温度500 K,其他壁面为绝热。初始温度为300 K,考虑瞬态热传导,当物体内部中心点处温度为420 K时停止计算。
-
启动STAR CCM+,新建Simulation -
利用菜单 File → Import → Import Volume Mesh…加载网格文件cylinder.msh
1 选择物理模型
-
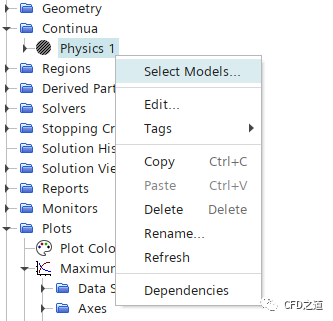
右键选择模型树节点 Continua > Physics 1,点击弹出菜单项Select Models...打开模型选择对话框
-
如下图所示选择物理模型
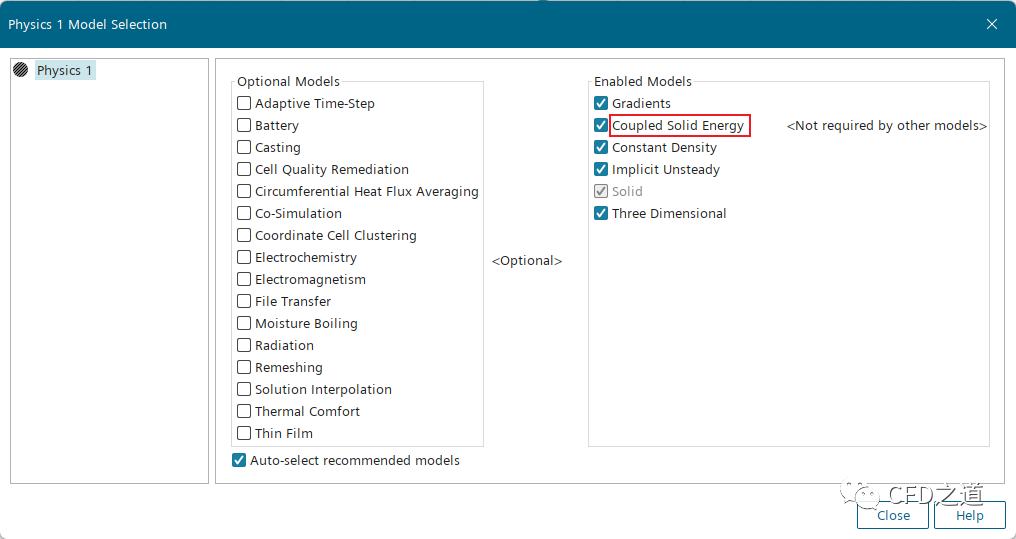
注:这里选择能量方程时要小心,建议选择使用Coupled Solid Energy。若选择使用Segregated Solid Energy,需要足够多的内迭代次数,否则计算出来的结果和Coupled Solid Energy及Fluent计算的结果相差巨大。利用Coupled Solid Energy或Fluent进行计算得到1.8 s时监测点达到420K,但Segregated Solid Energy在内迭代次数设置为40 时,得到的结果为2.25 s才能达到420 K。当内迭代次数减少时,Segregated Solid Energy方法计算结果显示需要的时间更多,如使用默认内迭代次数5时,需要9.9 s,显然是错误的。而Coupled Solid Energy在内迭代次数为5 时,依然能够计算得到1.8 s时刻监测点达到420。
”
2 修改材料属性
-
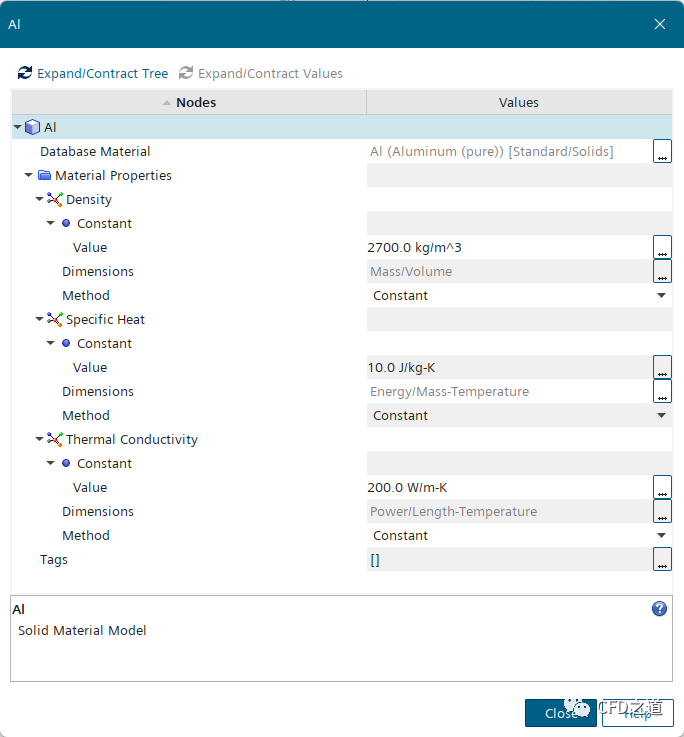
双击模型树节点 Continua > Physics 1 > Models > Solid > AI,打开材料属性设置对话框,如下图所示设置材料参数
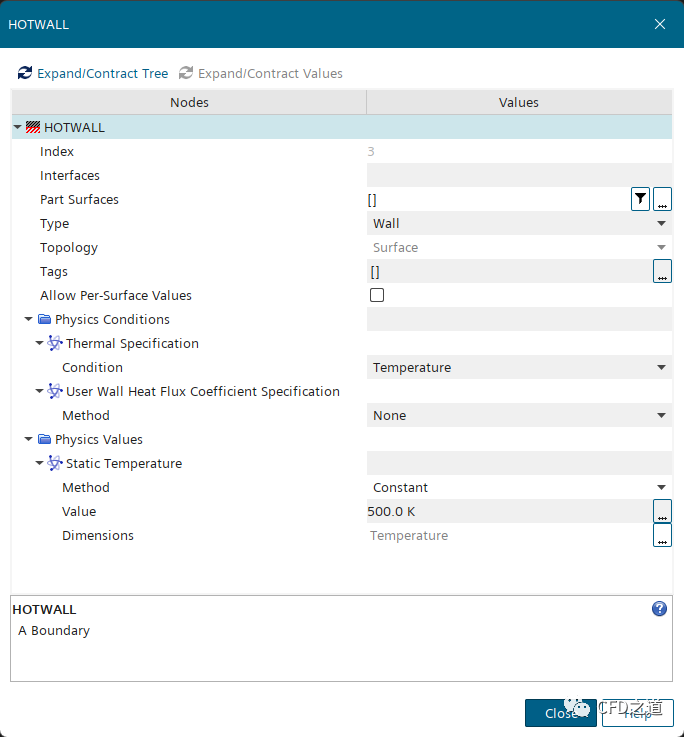
3 指定边界条件
-
双击节点 Regions > Boundaries > HOTWALL,如下图所示设置其温度为500 K ,其他边界保持默认设置
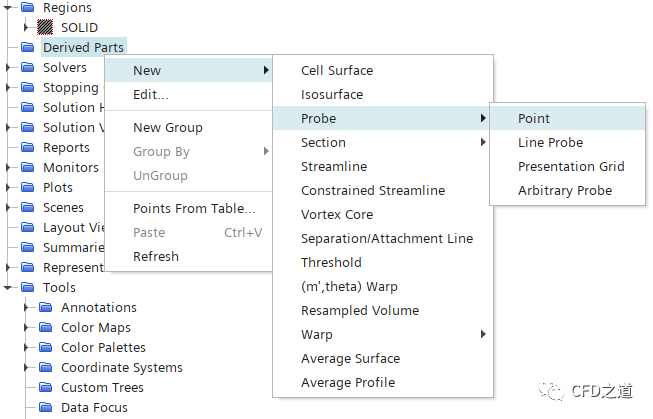
4 设置监测点
-
右键选择模型树节点 Derived Parts,点击弹出菜单项New → Probe → Point打开设置对话框
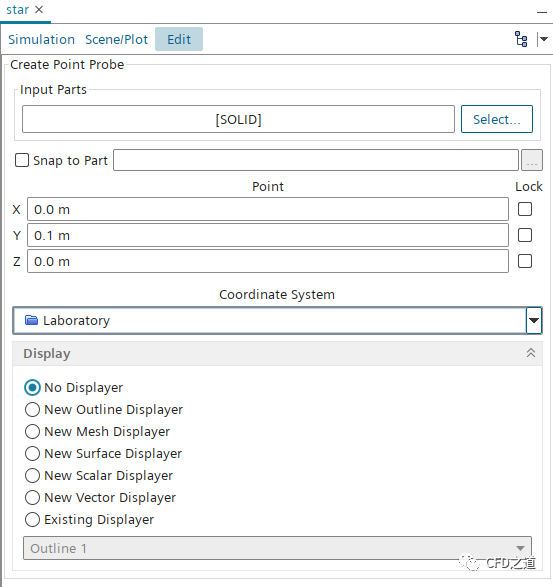
-
如下图所示设置监测点坐标
5 设置监测点
-
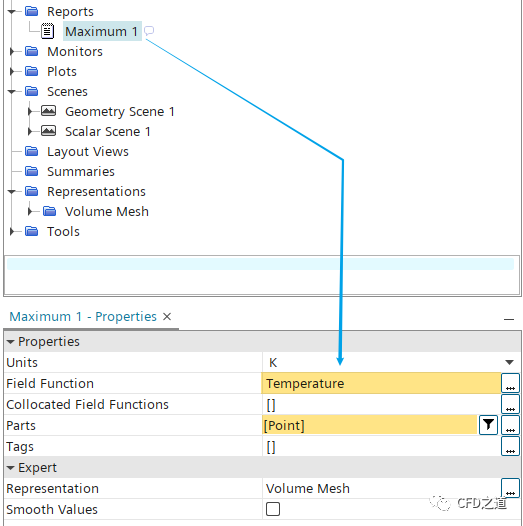
右键选择模型树节点 Reports,点击弹出菜单项New → User → Maximum创建新节点
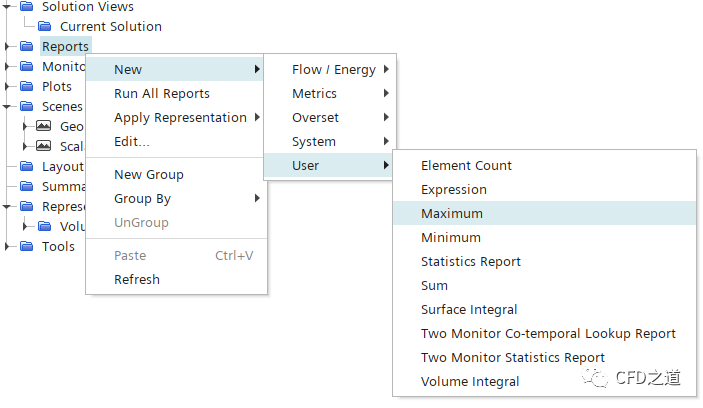
注:这里监测的是点的数据,因此Maximum与Minimum的值是一样的,随便选择哪一个都可以。
”
-
如下图所示设置新节点 Maximum 1的参数
-
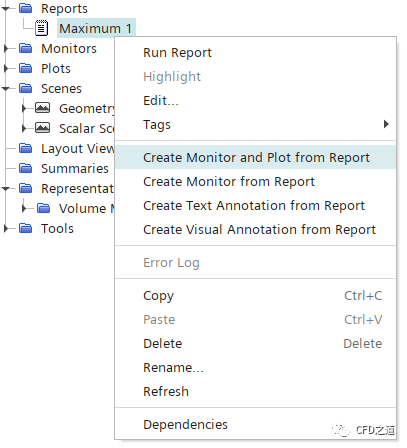
右键选择模型树节点 Maximum 1,点击弹出菜单项Create Monitor and Plot from Report创建监测值显示
6 求解参数
-
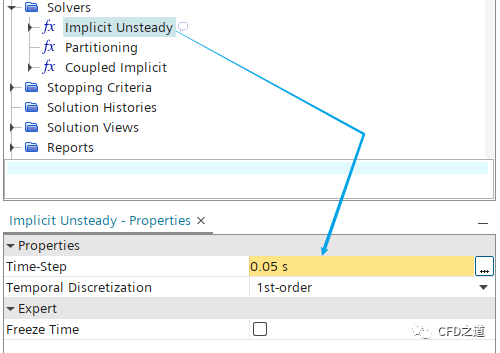
选中模型树节点 Solvers > Implicit Unsteady,指定参数Time Step为 0.05 s
-
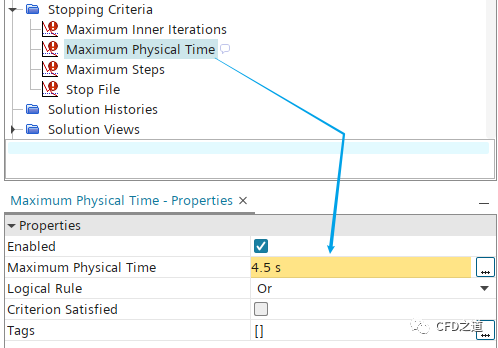
选中模型树节点 Stopping Criteria > Maximum Physical Time,如下图所示指定参数Maximum Physical Time为 4.5 s
7 设置仿真操作
利用Simulation Operations控制仿真过程。基本思路为:判断监测值与目标值的差距,以此来判断是继续迭代计算还是终止计算。
注:此方法并未成功,尚不清楚问题出在哪里。
”
-
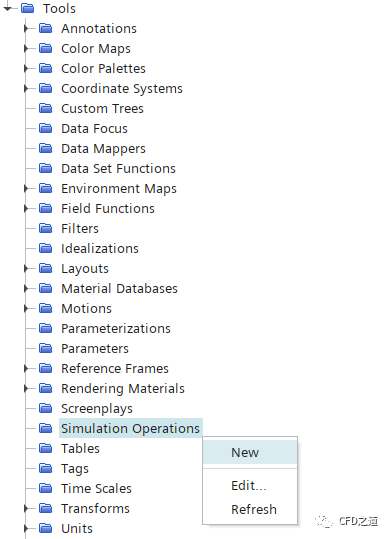
右键选择模型树节点 Tools > Simulation Operations,点击弹出菜单项 New 创建新节点
-
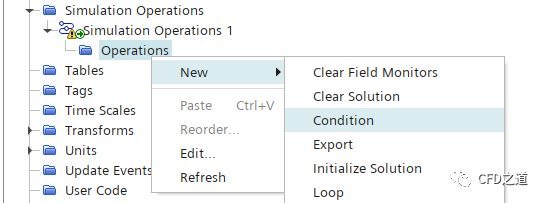
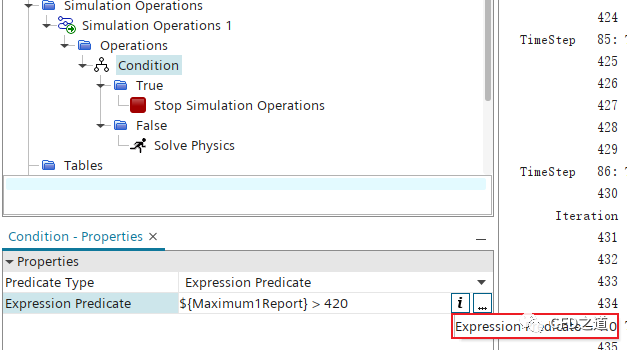
如下图所示,右键选择模型树节点 Operations, 点击弹出菜单项New → Conditions创建判断条件
-
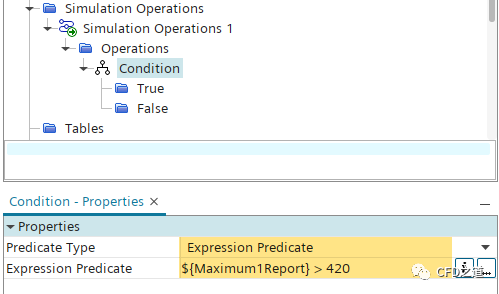
选中节点 Condition,如下图所示设置判断表达式
-
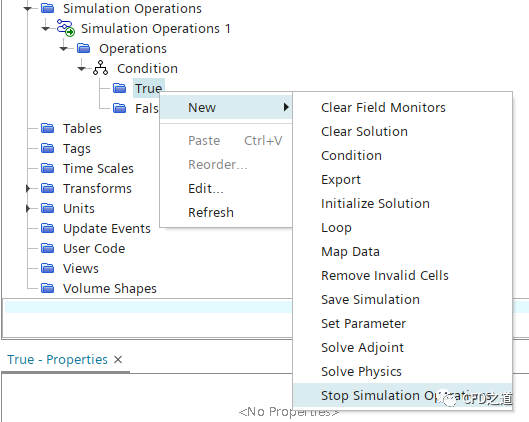
右键选择节点 True,点击弹出菜单项New → Stop Simulation Operations。表示当Condition满足时(报告值>420),终止仿真计算。
-
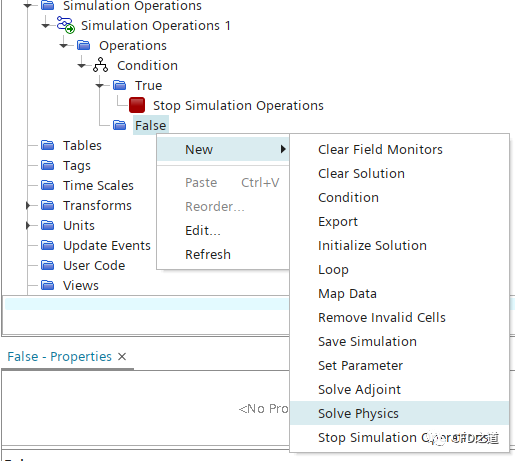
右键选择节点 False,点击弹出菜单项New → Solve Physics。
-
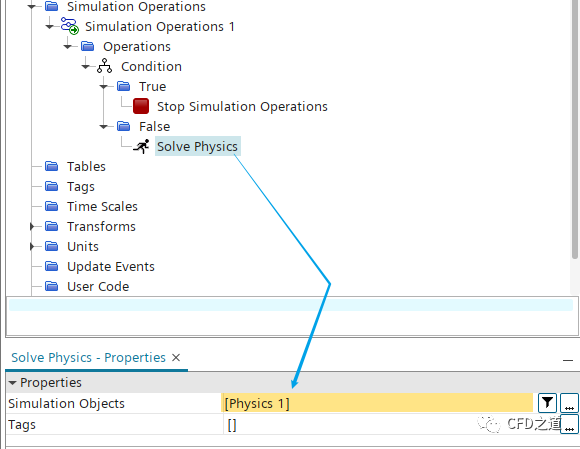
选中节点 Solve Physics,如下图所示设置参数Simulation Objects为 Physics 1
-
右键选择模型树节点 Simulation Operations 1,点击菜单项Play/Resume Simulation Operations执行计算
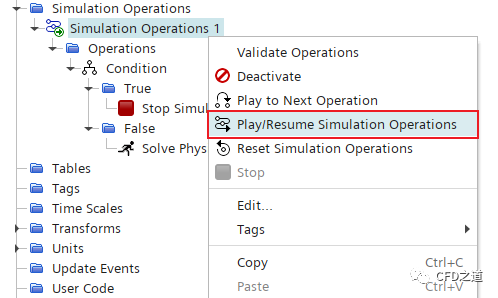
但似乎没起作用,计算并没有在监测值达到420时终止计算。
事实上Simulation Operations是做了正确判断的,但目前不知道什么原因,其并没有执行Ture分支下的终止计算指令。更换表达式将Ture和False调换也没有用。
8 利用脚本控制流程
上面的方法不奏效,那就用java脚本进行控制,这个更简单。
两个工作:
-
获取监测值 -
判断监测值,并停止计算
脚本可以限录制,然后进行改造,改造完毕后的代码如下图所示。代码文件保存为control.java。
注意:在读入此文件之前,需要将中文注释清除掉,否则会因为无法识别而报错。
”
// control.java
// Written by Simcenter STAR-CCM+ 18.04.008
package macro;
import java.util.*;
import star.common.*;
import star.base.report.*;

public class control extends StarMacro {
  public void execute() {
    execute0();
  }

  private void execute0() {
    Simulation simulation_0 =getActiveSimulation();
    Solution solution_0 =simulation_0.getSolution();
    solution_0.initializeSolution();
	while(true)
	{
		//获取report的值。这里report的名称为Maximum 1,与软件中定义的名称保持一致
		    MaxReport maxReport_0 =
      ((MaxReport) simulation_0.getReportManager().getReport("Maximum 1"));
		double maxTemp = maxReport_0.getReportMonitorValue();

		//将获取的监测值与目标值进行比较
		if(maxTemp <= 420)
		{
			//若监测值小于420,则迭代计算
			simulation_0.getSimulationIterator().step(1);
		}
		else{
			//超过420则终止迭代计算
			simulation_0.getSimulationIterator().stop();
            	    simulation_0.println("Reach target value, stop iteration!");
			//break用于跳出循环,非常重要
			break;
		}
	}
  }
}
-
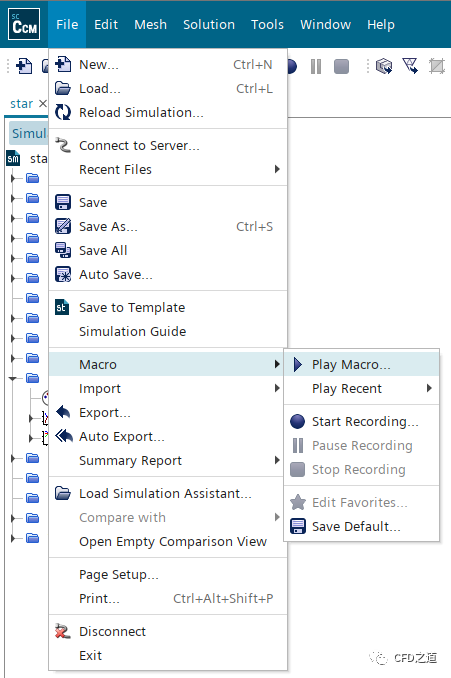
点击菜单项 File → Macro → Play Macro...,打开文件选择对话框
-
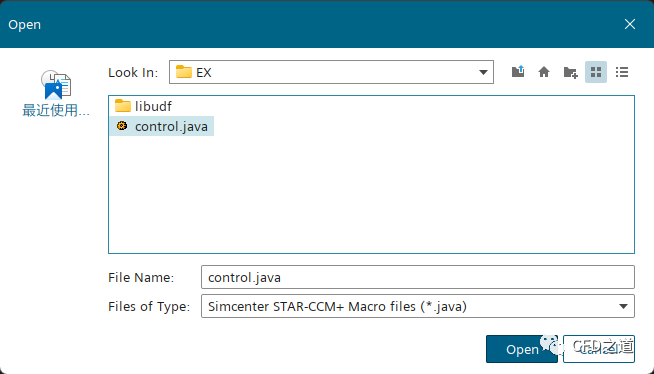
选择并打开脚本文件 control.java
-
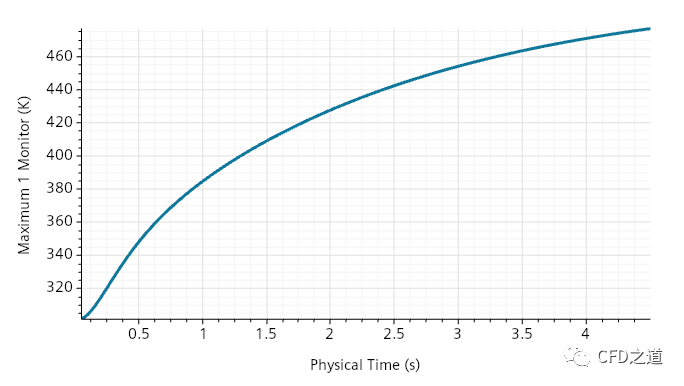
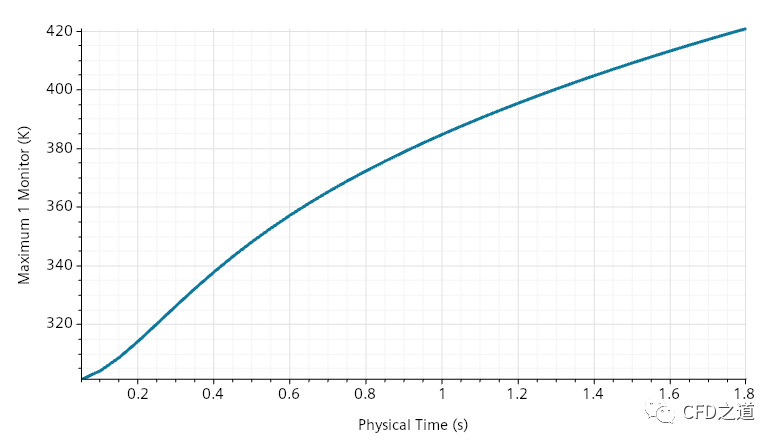
运行结果如下图所示
-
计算在1.8 s时刻自动终止,此时监测点的温度值为420.7122 K

文件链接:链接:https://pan.baidu.com/s/1PpsHI1baxmfC8uLEv9XW-Q?pwd=gowy 提取码:gowy
操作视频:【STAR CCM+案例|监测值达到目标时终止计算】 https://www.bilibili.com/video/BV1S84y127iB/?share_source=copy_web&vd_source=30f46a83b55f71385e5d51b52bf33e4f
”
(完)

本篇文章来源于微信公众号: CFD之道


评论前必须登录!
注册