本案例利用STAR CCM+中的DES模型及FW-H模型模拟圆柱绕流实时噪声。
注:本案例为STAR CCM+随机案例。
”
1 打开初始文件
-
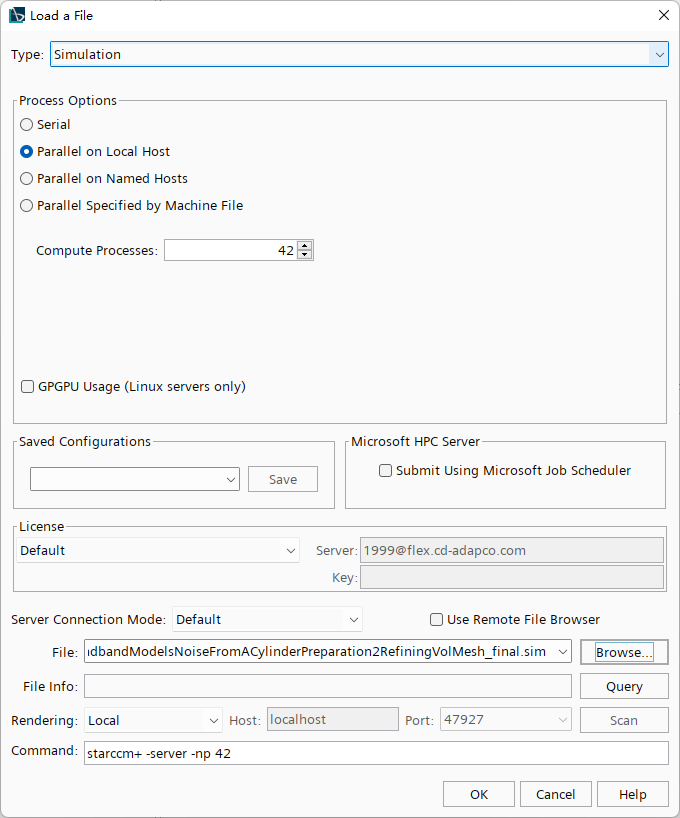
启动STAR CCM+,加载初始文件BroadbandModelsNoiseFromACylinderPreparation2RefiningVolMesh_final.sim,另存仿真文件为cylinderUnsteady.sim
2 选择物理模型
-
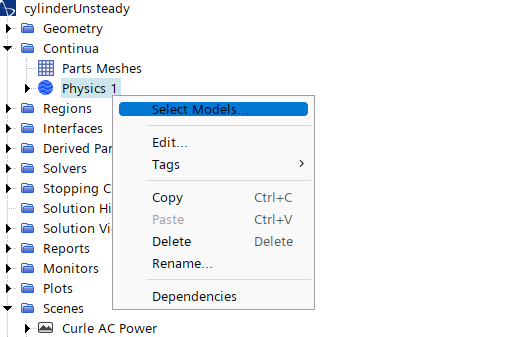
选择物理模型
-
取消以下物理模型
-
Proudman -
Noise Source Models -
Curle -
Broadband Noise Sources -
Aeroacoustics -
All y+ Wall Treatment -
All y+ Wall Treatment -
SST (Menter) K-Omega -
K-Omega Turbulence -
Reynolds-Averaged Navier-Stokes -
Turbulent -
Steady
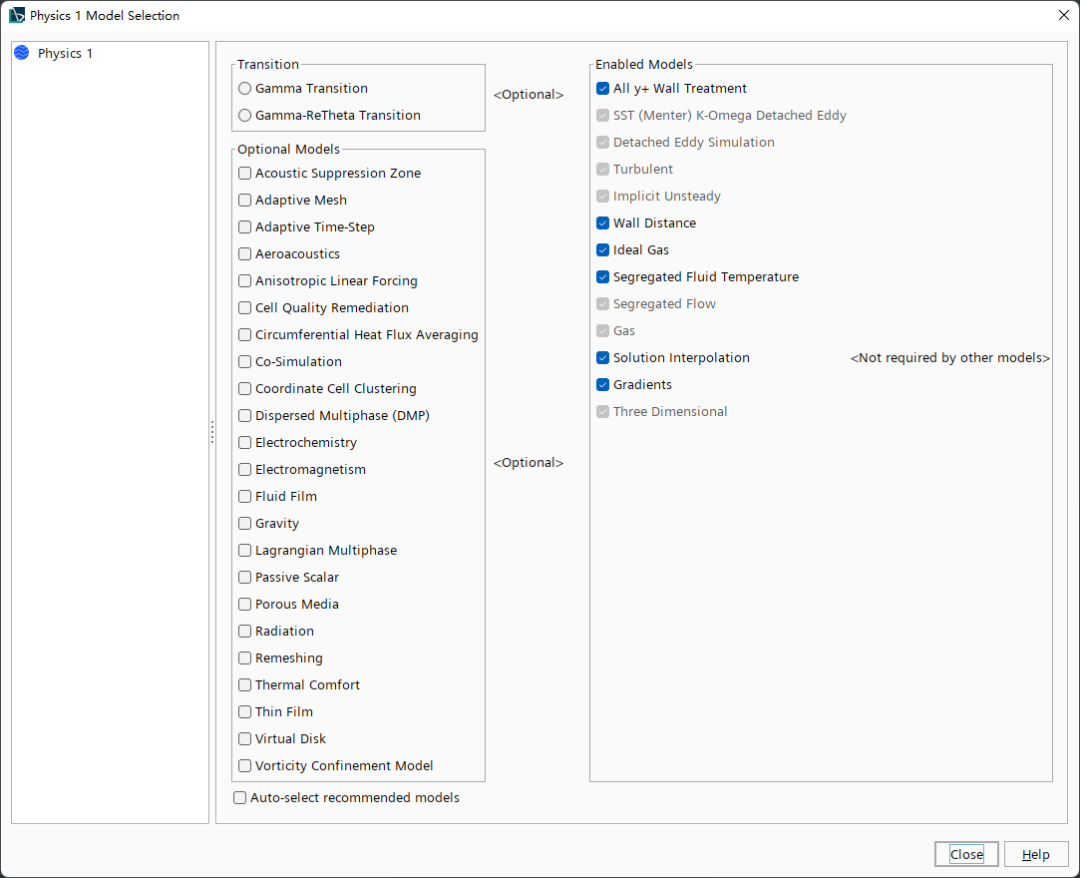
取消选项Auto-select recommended models,并重新选择以下模型:
-
Implicit Unsteady -
Turbulent -
Detached Eddy Simulation -
SST(Menter)K-Omega Detached Eddy -
All y+ Wall Treatment
选择完毕的模型对话框如下图所示。
-
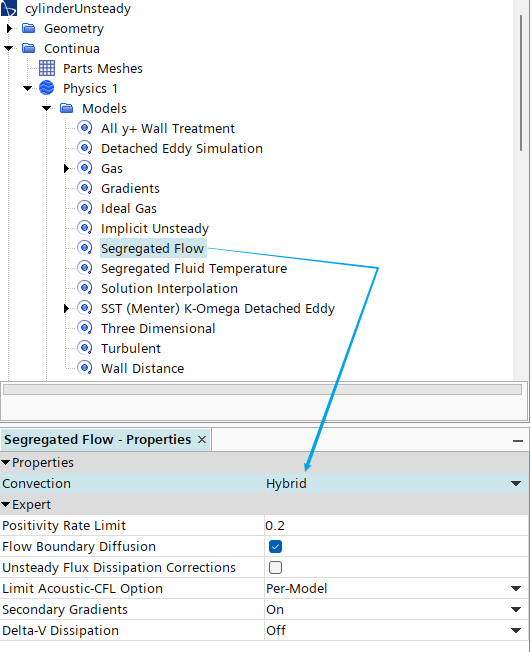
如图所示,选中模型树节点Segregated Flow ,指定属性参数 Convection为Hybrid
-
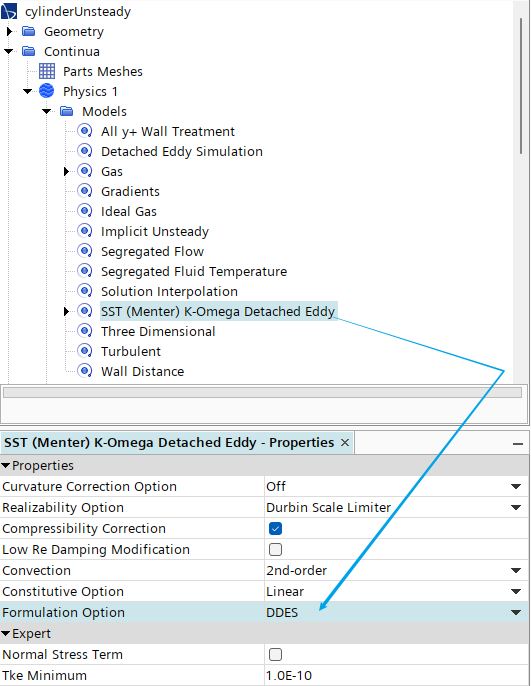
选中模型树节点SST(Menter)K-Omega Detached Eddy ,设置参数 Formulation Option为DDES
3 设置求解参数
在设置声学模拟时,需要选择合理的时间步长。
通常要评估以下条件并选择最小值:
-
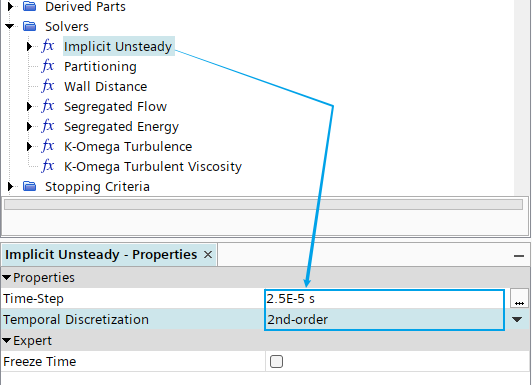
对流库朗数:隐式解算器通常在局部10-100范围内的最大值处稳定,但总体平均值应在1左右。在本案例中,2.5E-5s的时间步长能得到一个平均值约为1的对流Courant数。 -
最大解析频率:例如要在3000 Hz的波中获得10个点(在人类听力最敏感的点周围),时间步长应为10 x 3000 Hz=30000 Hz,或3.33E-5 s。 -
局部 Strouhal 脱落:在本案例采用的雷诺数为 63800,圆柱体在Strouhal数大约为 0.22 时涡脱落。此数字对应脱落频率 500 Hz。捕捉此脱落频率需要的时间步大小为 2.0E-4 s。
最小时间步长可取对流库朗数标准要求的大小 2.5E-5 s。
-
点击模型树节点Solvers > Implicit Unsteady ,设置时间步长为2.5e-5 s ,设置Temporal-Discretization 为2nd-order
-
Solvers > Segregated Flow > Velocity设置亚松弛因子为0.9 -
Segregated Flow > Pressure设置亚松弛因子为0.7 -
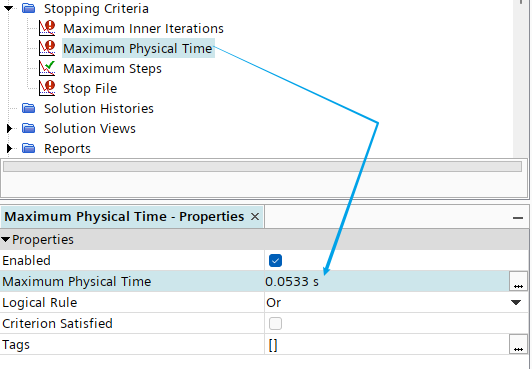
设置Maximum Physical Time 为0.0533 s
-
取消激活选项Maximum Steps -
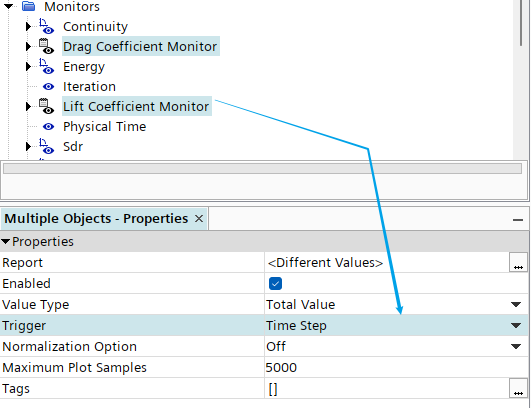
选中 Monitors节点下的子节点 Drag Coefficient Monitor 及Lift Coefficient Monitor ,设置Trigger为Time Step ,如下图所示
4 显示平均速度
-
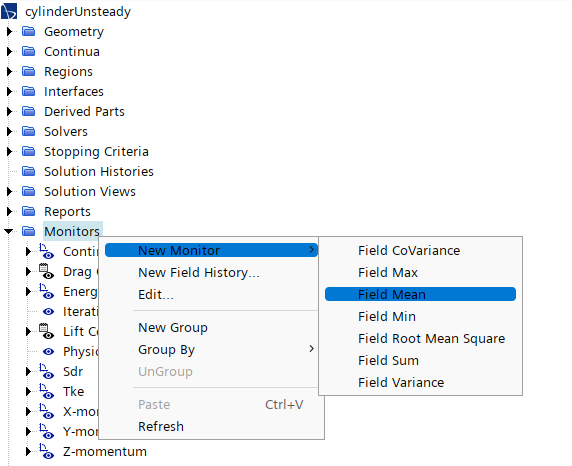
右键选择模型树节点Monitors ,点击右键菜单New Monitor > Field Mean
-
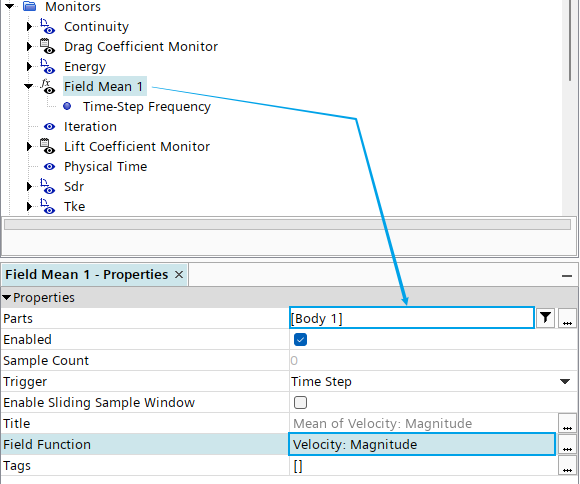
选择模型树节点Field Mean 1 ,指定其参数 Parts为Body 1 ,指定Field Function为Velocity Magnitude ,如下图所示
-
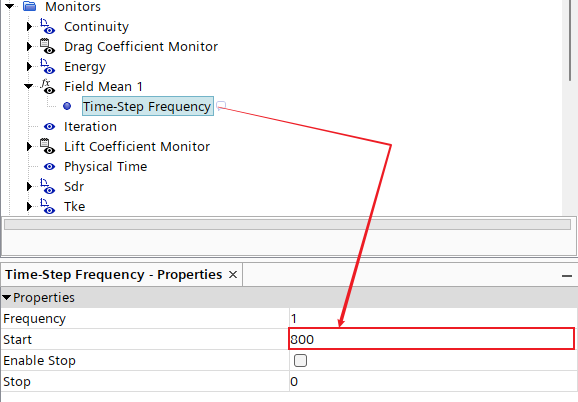
选中节点Field Mean 1 > Time-Step Frequency ,指定参数 Start为800
-
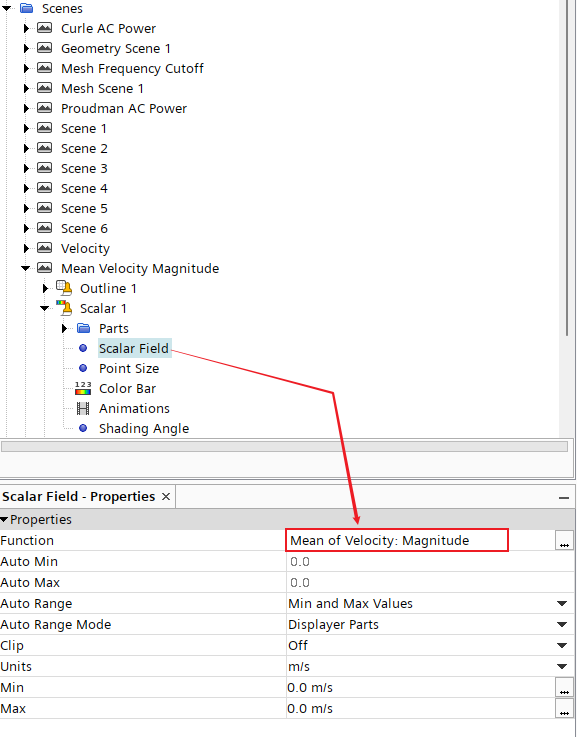
拷贝并粘贴模型树节点 Scenes > Velocity,重新命名节点为Mean Velocity Magnitude,指定Scalar Field为Mean of Velocity:Magnitude
5 监测压力
-
右键选择模型树节点Derived Parts ,点击弹出菜单项New Part > Probe > Point ,创建3个监测点
| 序号 | 监测点名称 | 坐标 |
|---|---|---|
| 1 | Probe-back | [0.0101, 0, 1e-4] |
| 2 | Probe-bottom | [0, -0.0101, 1e-4] |
| 3 | Probe-top | [0, 0.0101, 1e-4] |
创建完毕后的三个点位置如下图所示。
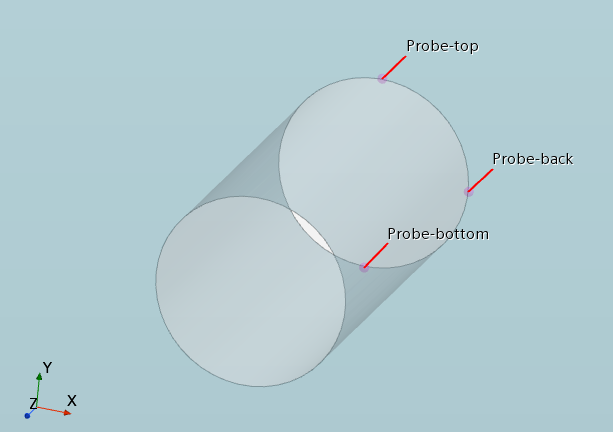
-
鼠标右键选择模型树节点Reports ,点击弹出菜单项New Report → User → Maximum 创建监测报告 Pressure-back
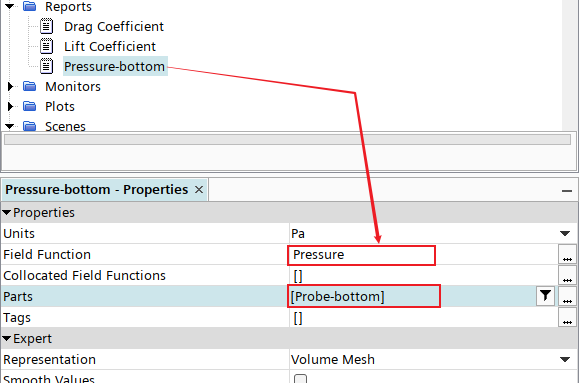
-
相同方式创建另外两个压力监测点,命名为 Probe-top与Probe-bottom,主要修改监测点位置 -
同时选中三个压力监测报告,点击右键菜单Create Monitor and Plot from Report
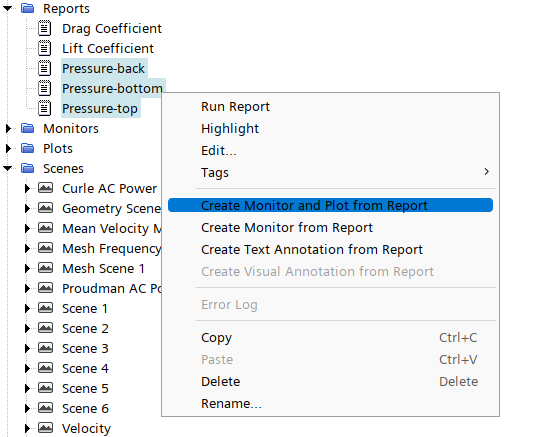
-
弹出对话框中选择Single Plot
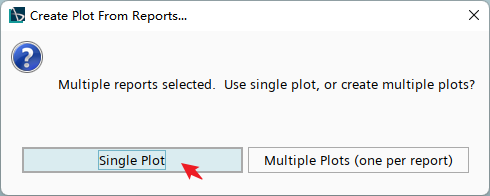
-
修改节点Plots > Reports Plot名称为Pressure Probes Plot
6 监测力系数
-
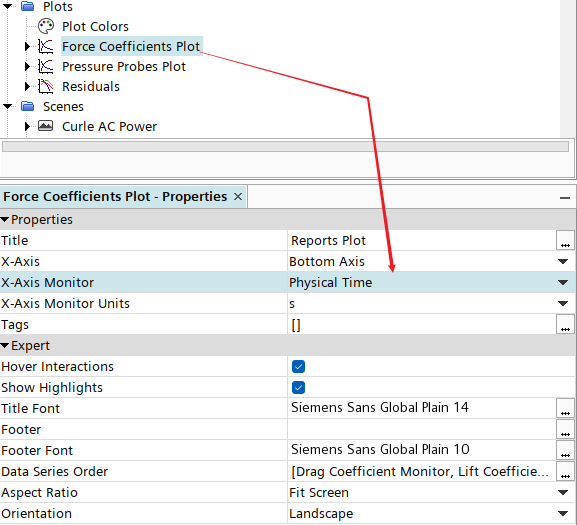
选中模型树节点Plots > Force Coefficient Plot ,设置参数 X-Axis Monitor为Physical Time
7 保存瞬态数据
-
选择菜单File > Auto Export… 打开文件输出对话框
| 节点 | 值 |
|---|---|
| File Format | Surface fft files (*.trn) |
| Base Name | cylinderPressureData |
| Append to File | 激活 |
| Export Solution Data Only | 激活 |
| Scalar Functions | Pressure |
| Boundaries | Body 1:Cylinderwall |
| Derived Parts | plane section |
| Update | 激活 |
| Trigger | Time Step |
| Time Step Frequency | |
| Frequency | 1 |
| Start | 50 |
设置完毕后的对话框如下图所示。
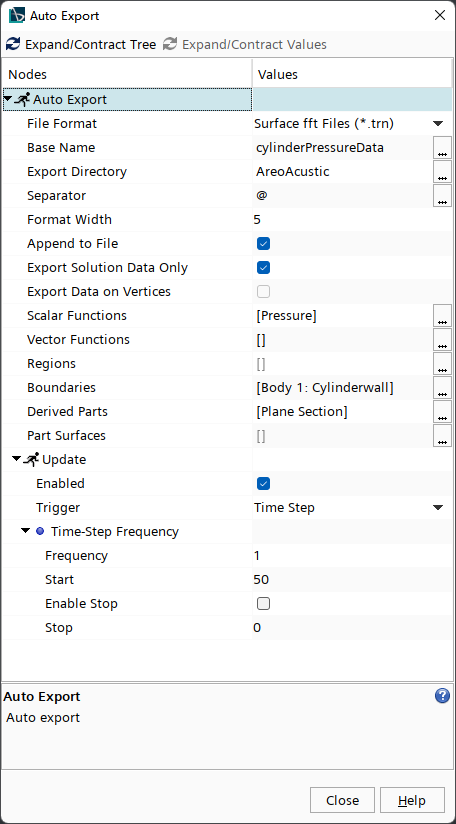
注:Auto Export功能还可以用于导出数据在第三方气动声学软件中使用。若有此需要,请选择文件格式为CD-adapco CCM File (*.ccm) ,因为很多第三方软件(如Actran、VA One 和 Virtual.Lab.Acoustics)可以直接读取 .ccm 格式。对于体积数据,使用Region属性选择适当区域;对于表面数据,可根据以上所示方式选择适当边界或衍生零部件。
”
8 设置FW-H分析
-
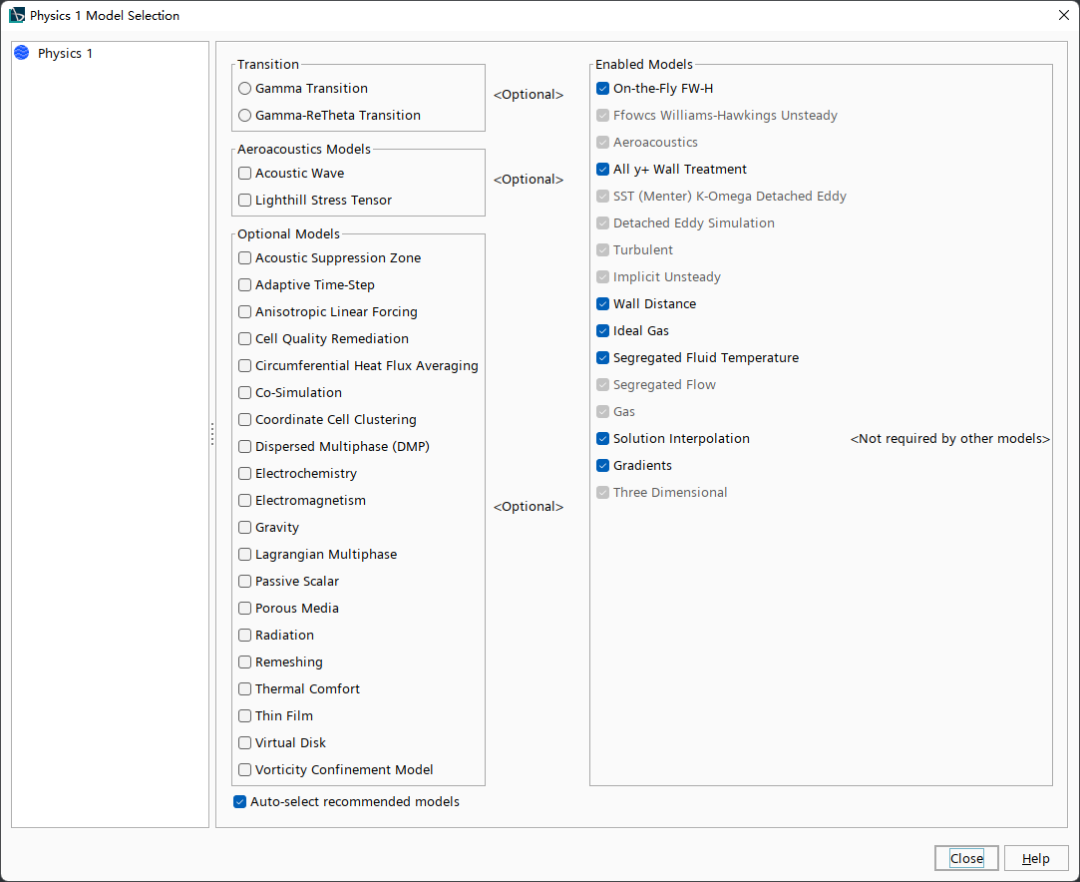
右键选择模型树节点 Continua > Physics 1 ,点击弹出菜单项Select Models…,添加以下物理模型 -
Aeroacoustics -
Ffowcs Williams-Hawkings Unsteady -
On-The-Fly FW-H
选择完毕后的对话框如下图所示。
-
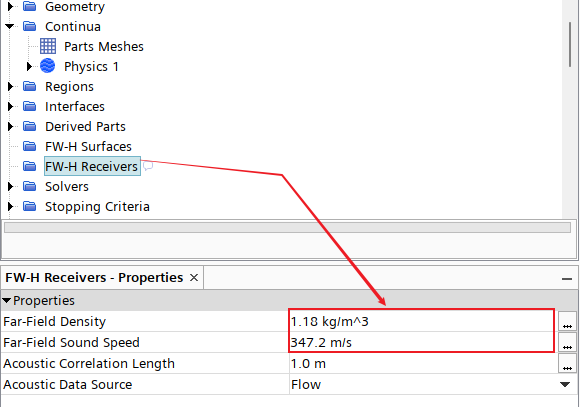
选中模型树节点FW-H Receivers ,如下图所示设置参数
9 设置FW-H面
-
右键选择模型树节点FW-H Surfaces ,点击弹出菜单项New > Impermeable Surface
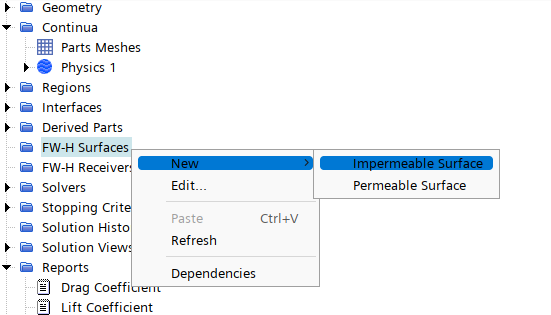
-
设置 Boundaries为Body 1:Cylinderwall ,如下图所示
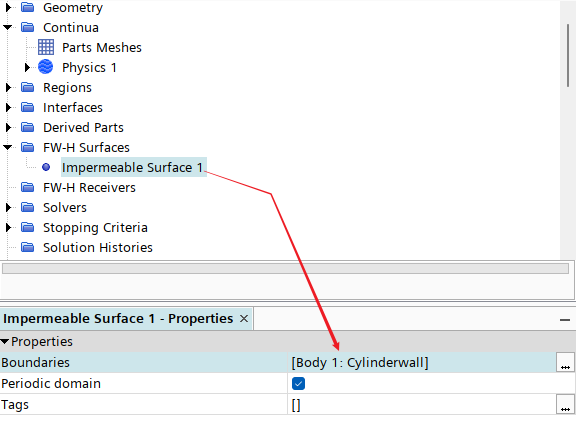
10 设置FW-H 接收器
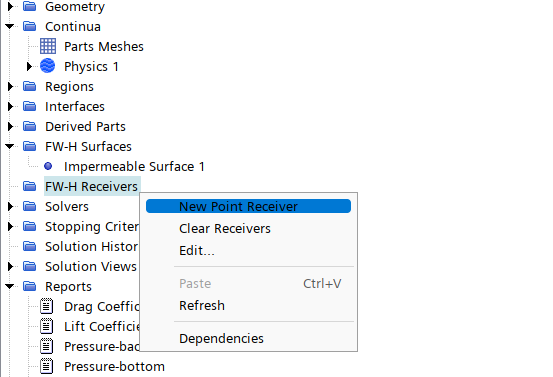
-
右键选择模型树节点 FW-H Receivers,点击右键菜单项New Point Receiver 创建节点OTF_FWH_Plus90deg100r
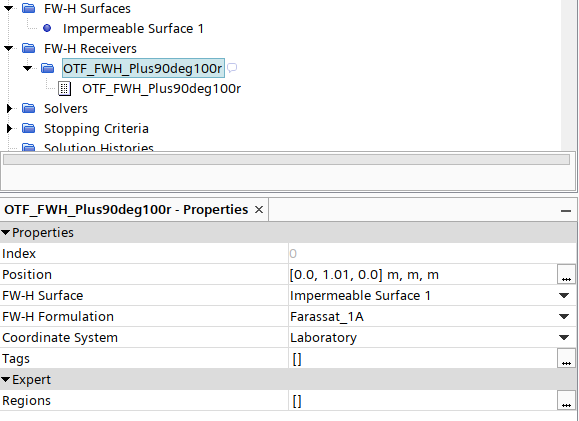
-
如下图所示设置节点OTF_FWH_Plus90deg100r属性
-
相同方式创建节点OTF_FWH_Minus90deg100r,设置节点属性如下图所示
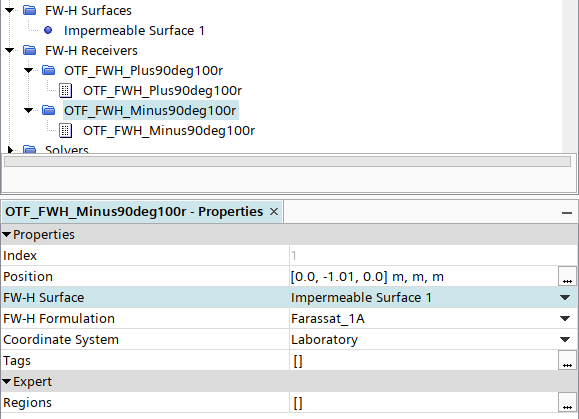
11 设置FW-H求解器参数
-
选择节点FW-H Unsteady Solver ,指定 Start Time为0.015 s
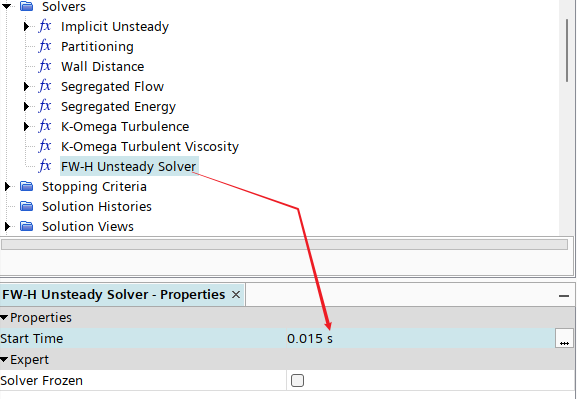
此参数用于定义点接收器开始计算声压时的物理时间
12 求解计算
-
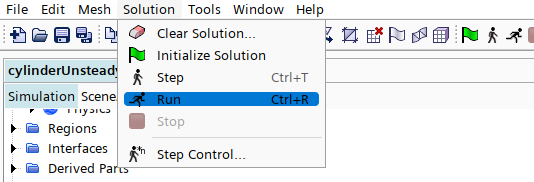
点击菜单Solution → Run 开始计算
13 计算结果
-
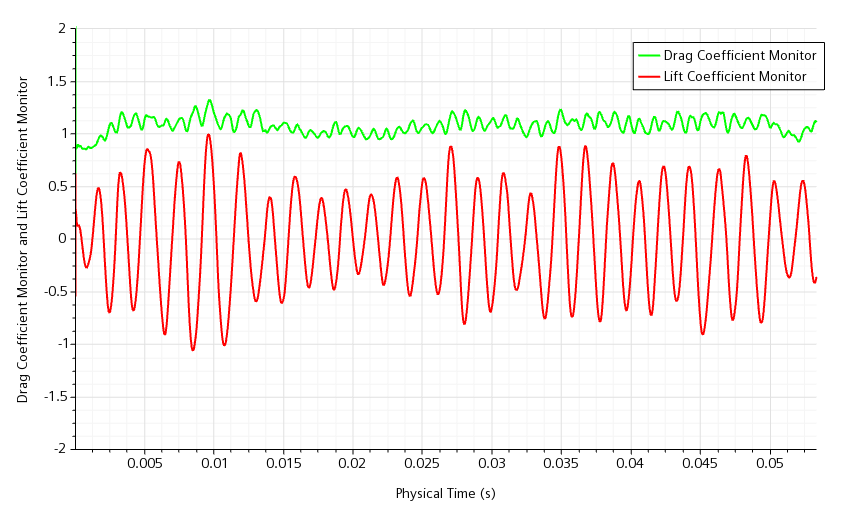
升阻力系数随时间变化曲线
-
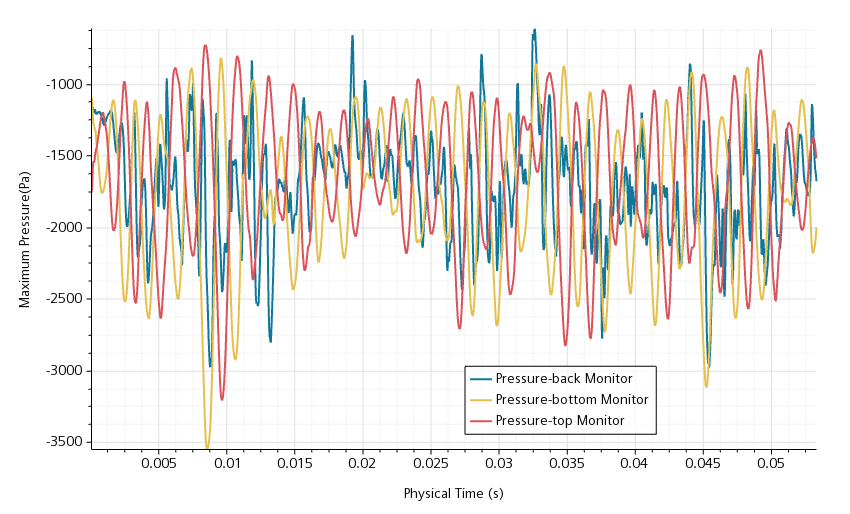
三个监测点上的最大压力随时间变化曲线
-
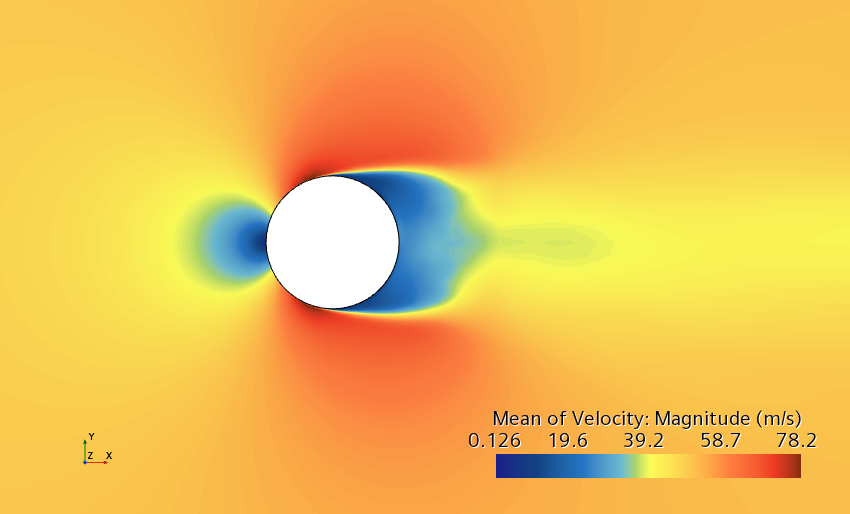
切面上的平均速度
14 进行谱分析
-
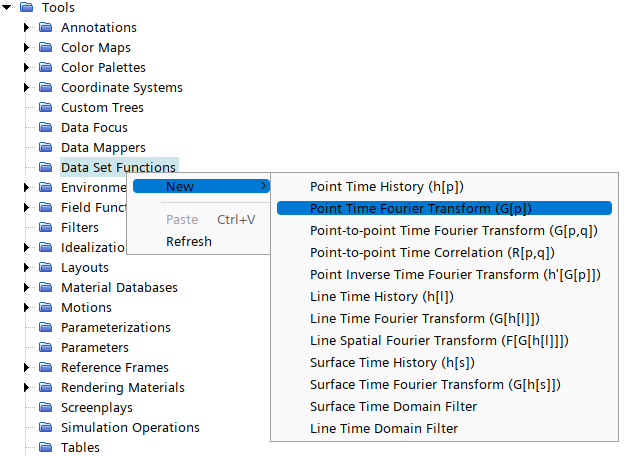
右键选择模型树节点Tools > Data Set Functions,点击弹出菜单项New > Point Time Fourier Transform (G(p))
-
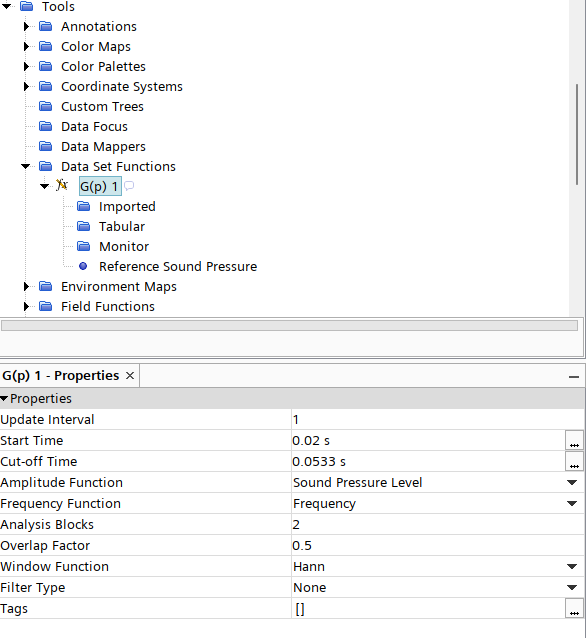
选中节点G(p) 1 ,如下图所示设置参数
-
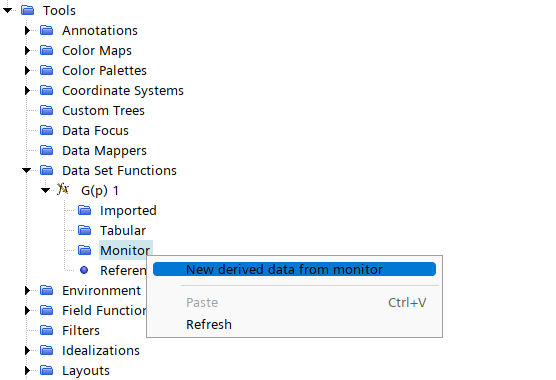
鼠标右键选择模型树节点G(p) 1 > Monitor,点击弹出菜单项New derived data from monitor创建节点 derived monitor-back
-
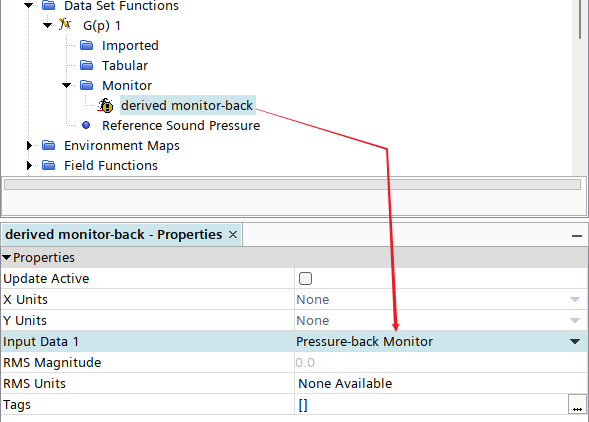
点击节点derived monitor-back,如下图所示选择 Input Data 1为Pressure-back Monitor
-
相同方式创建节点 derived monitor-bottom,选择Input Data 1为Pressure-bottom Monitor -
相同方式创建节点 derived monitor-top,选择Input Data 1为Pressure-top Monitor -
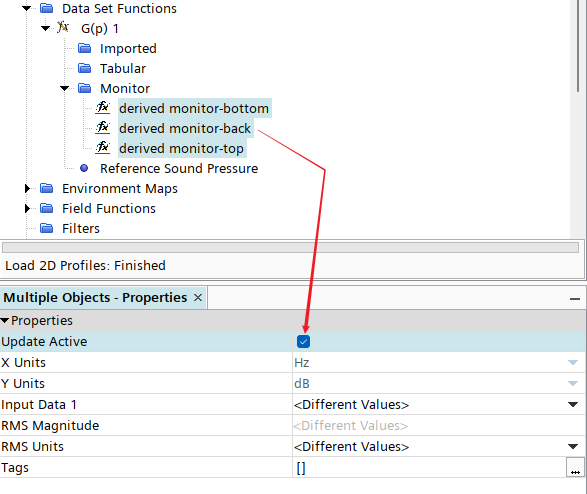
同时选择前面创建的三个节点,激活选项Update Active,如下图所示
-
将 G(p) 1 节点重新命名为 FFT-SPL -
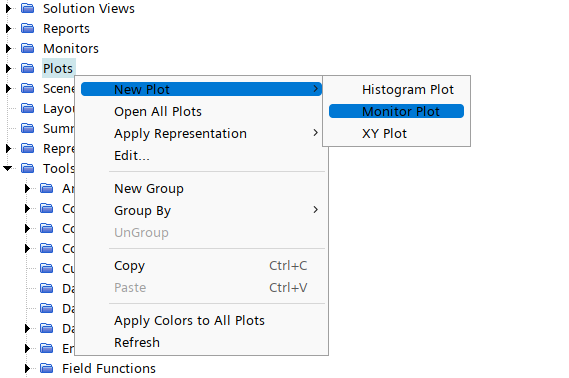
鼠标右键选择模型树节点Plots ,点击弹出菜单项New Plot > Monitor Plot 创建新节点 Monitor Plot - SPL
-
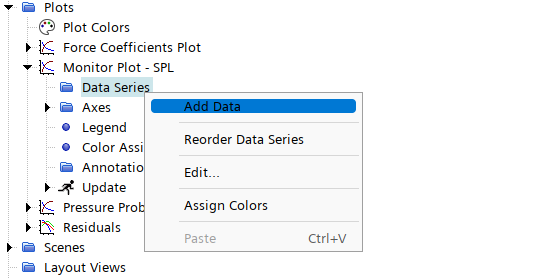
右键选择模型树节点 Plots > Monitor Plot - SPL > Data Series,点击弹出菜单项Add Data
-
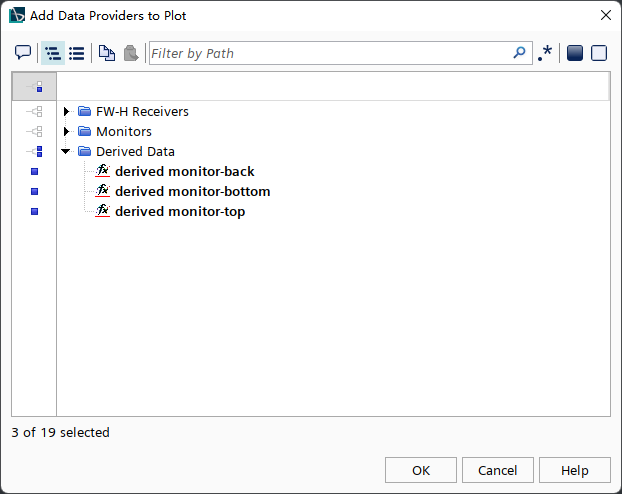
弹出的对话框中选择Derived Data下的三个节点,如下图所示
-
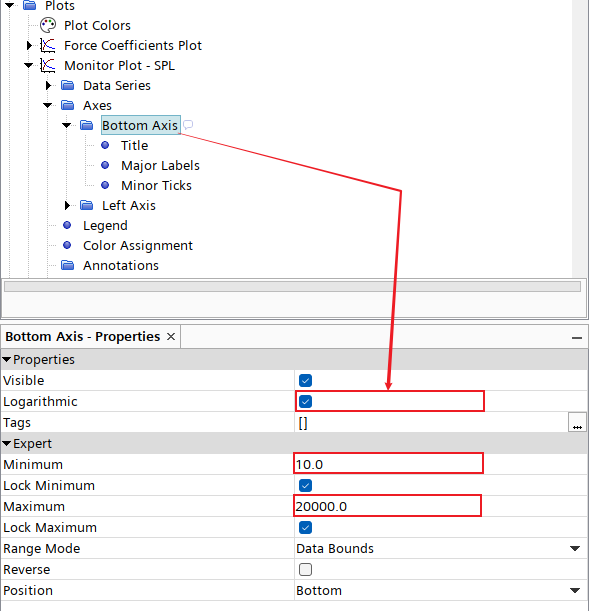
选中模型树节点Bottom Axis ,如下图所示设置参数
得到的声压级数据如下图所示。
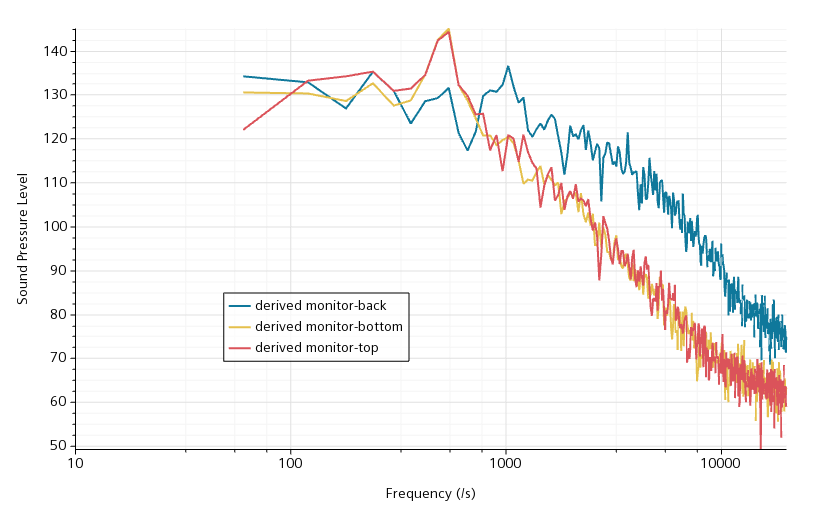
从图中看出,顶部与底部的声压级在540 Hz左右存在峰值,后部声压级在1000 Hz左右存在峰值。
(完毕)

本篇文章来源于微信公众号: CFD之道


评论前必须登录!
注册