本文描述在Tecplot中绘制多Y轴曲线图。
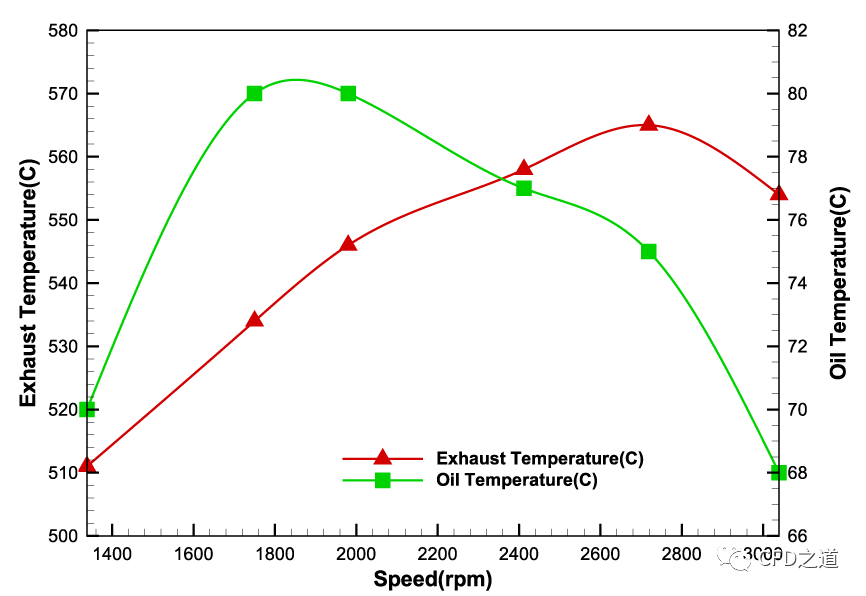
成品图如下图所示。
1 准备数据
案例所需的数据如下。采用文本文件保存,命名为engine.dat
| Speed(rpm) | Exhaust Temperature(C) | Oil Temperature(C) |
|---|---|---|
| 1338 | 511 | 70 |
| 1750 | 534 | 80 |
| 1980 | 546 | 80 |
| 2412 | 558 | 77 |
| 2719 | 565 | 75 |
| 3039 | 554 | 68 |
2 导入数据
-
启动Tecplot 360 -
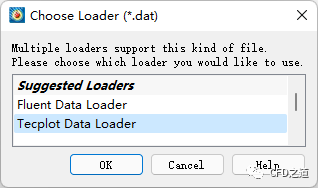
利用菜单File → Load Data… 导入数据文件engine.dat
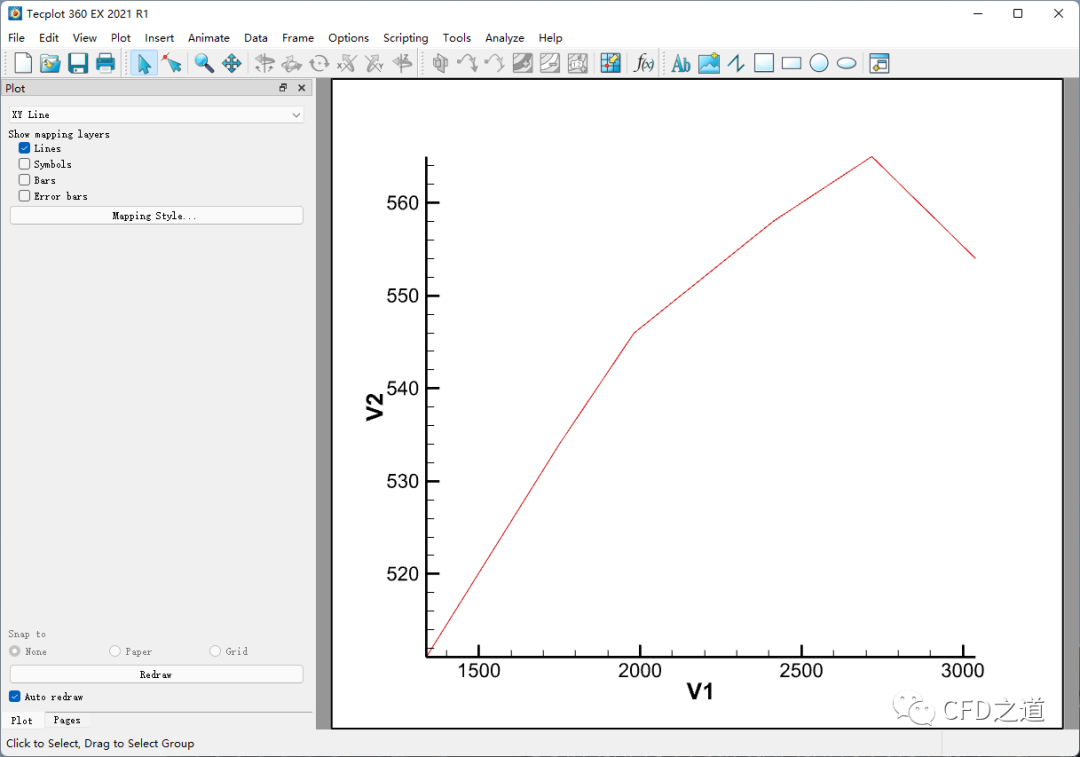
此时工作界面如下图所示。
3 调整图形大小
-
点击菜单Frame → Edit Active Frame… 打开设置对话框
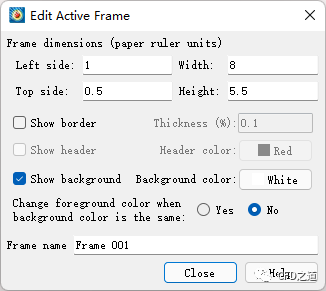
此时图形如下图所示。
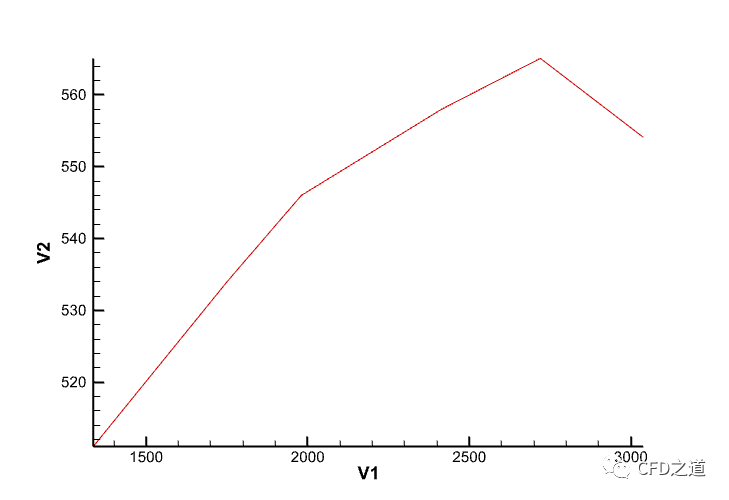
4 调整图形样式
-
激活操作面板中的Symbols 选项
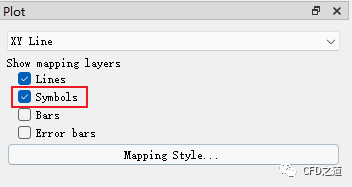
-
点击按钮 Mapping Style...进入设置对话框,其中Definitions选项卡如下图所示。注意下图中标识位置的选择
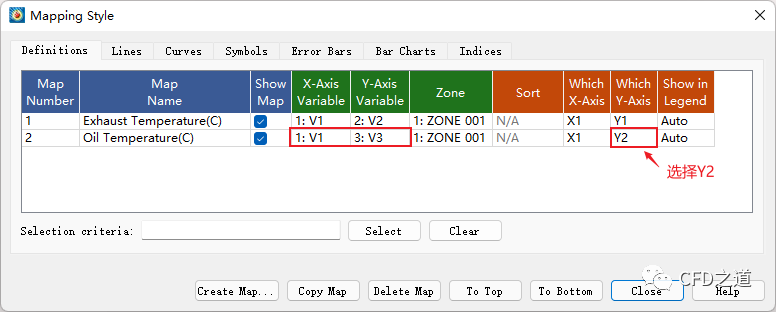
-
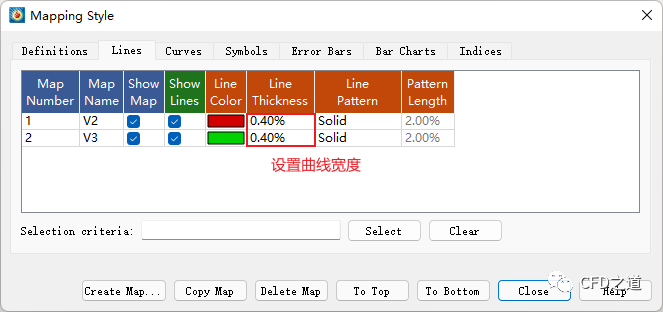
进入 Lines选项卡,指定两条线的宽度
-
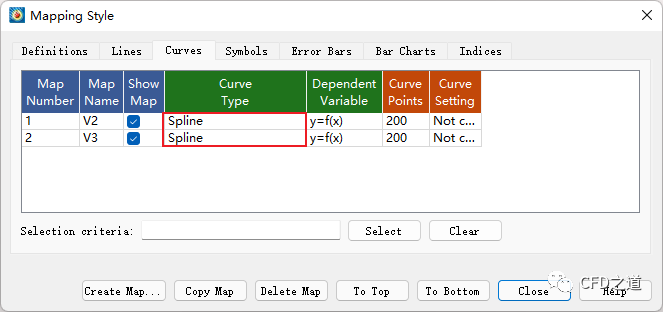
进入 Curves选项卡,指定两条线的形式为Spline ,采用光滑形式显示
-
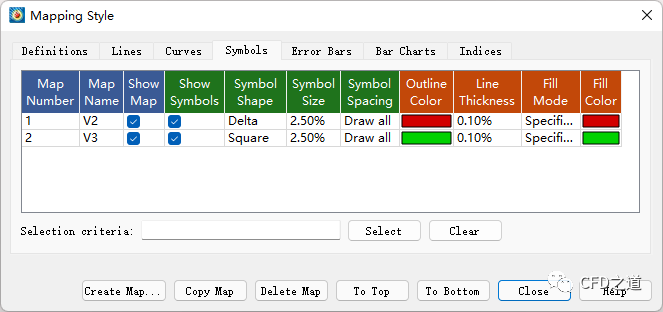
进入 Symbols选项卡,如下图所示设置标志点的样式
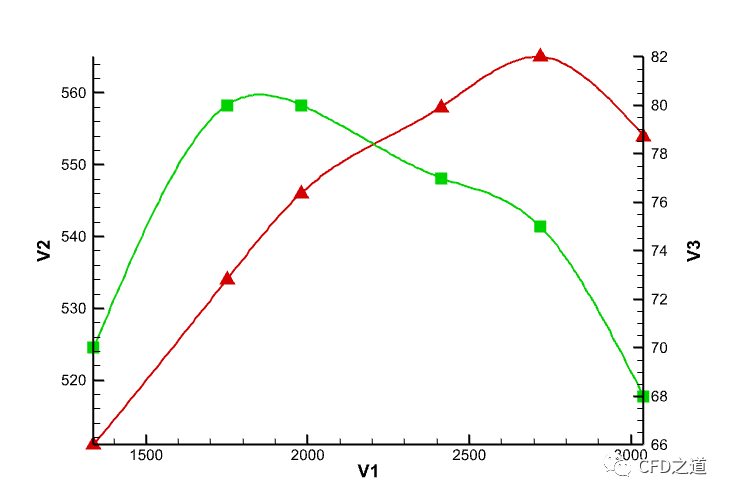
图形如下图所示。
5 调整坐标轴
5.1 调整X坐标
-
进入 X1设置 -
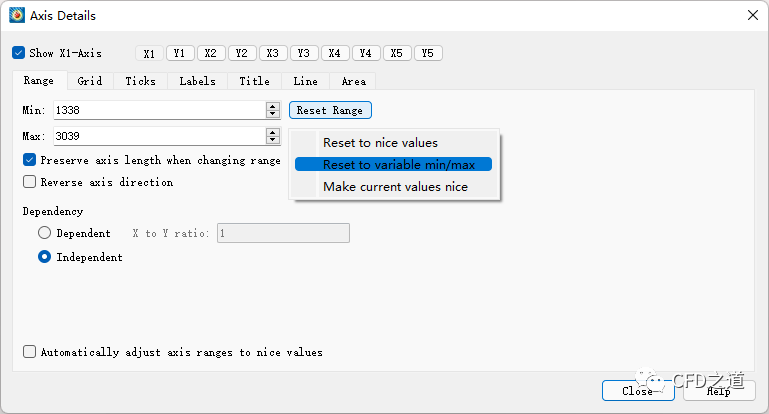
打开 Range选项卡,点击按钮Reset Range,选中弹出菜单项Reset to variable min/max
-
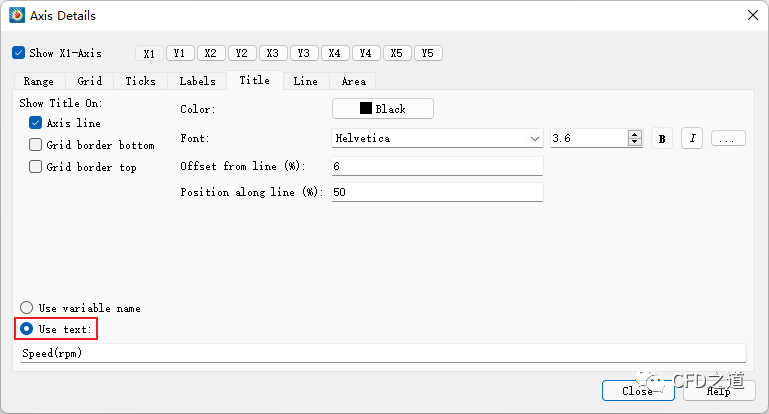
打开 Title选项卡,指定标签为Speed(rpm)
-
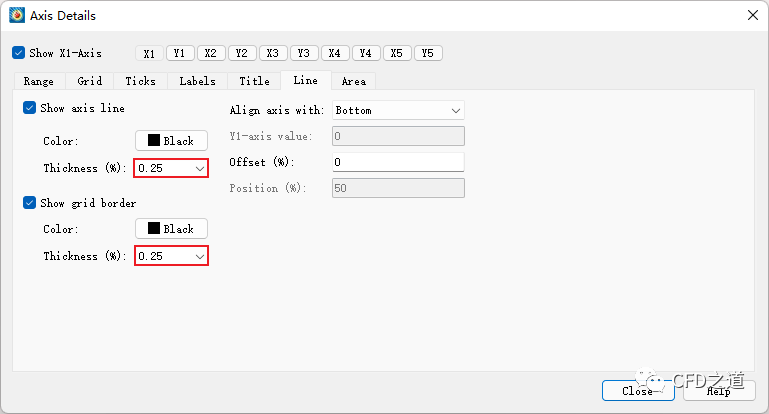
进入 Line选项卡,如下图所示指定线宽
-
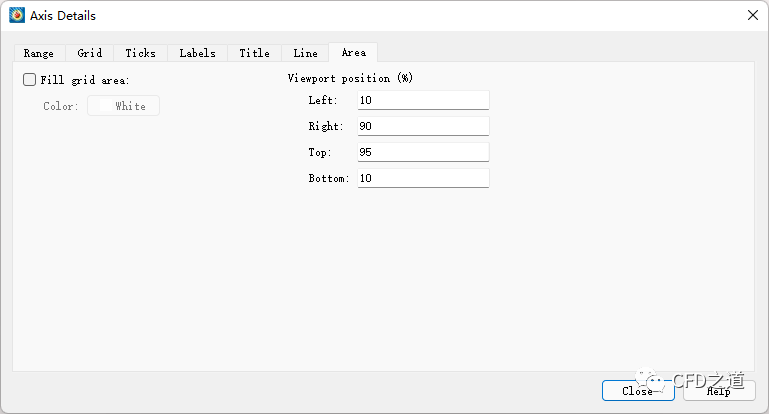
进入 Area选项卡,如下图所示指定图形位置
5.2 设置Y1
-
设置 Y1 -
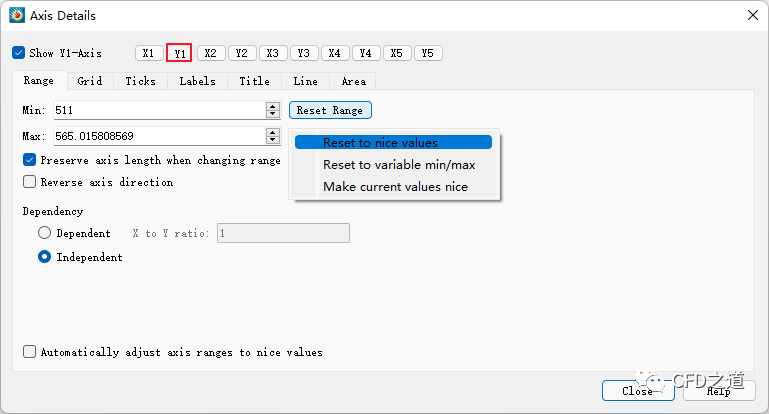
打开 Range选项卡,点击按钮Reset Range,选中弹出菜单项Reset to nice values
-
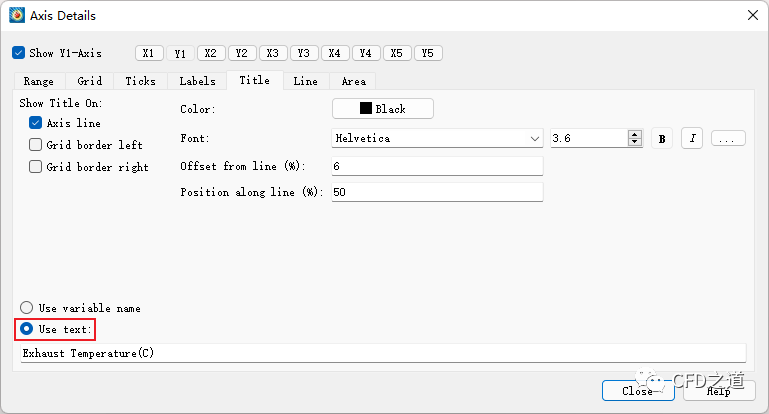
进入 Title,如下图所示指定坐标轴标签
-
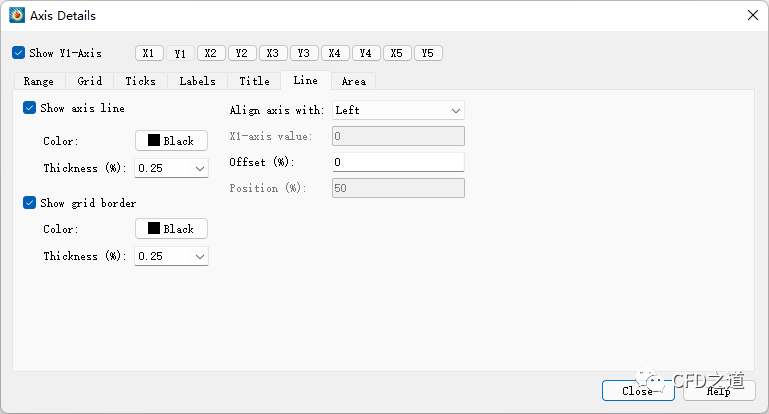
进入 Line选项卡,指定坐标轴线宽
5.3 设置Y2
-
激活 Y2 -
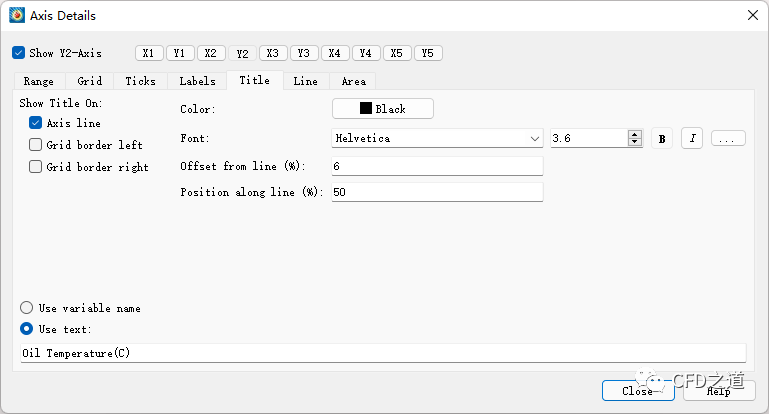
如下图所示,进入 Title选项卡,指定Y2坐标轴的标签
-
进入 Line,指定线宽为0.25
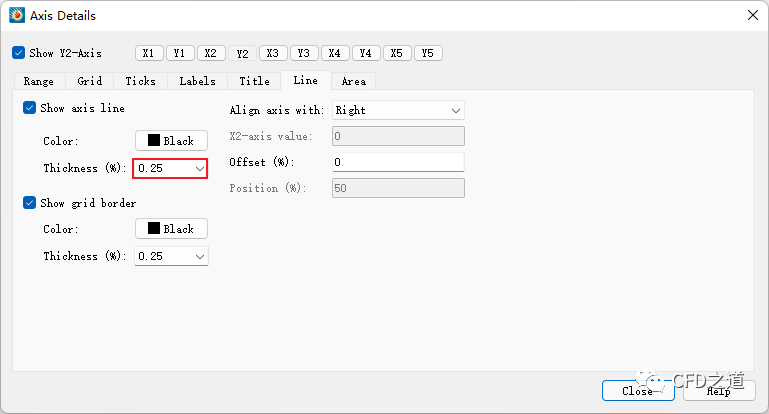
此时图形如下图所示。
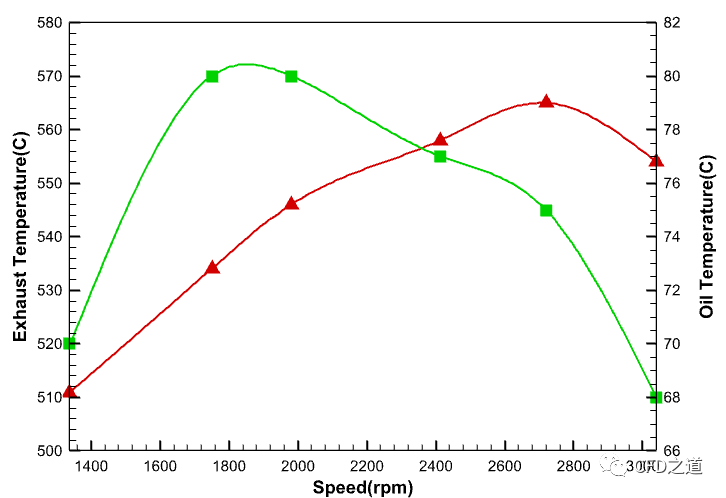
6 添加图例
-
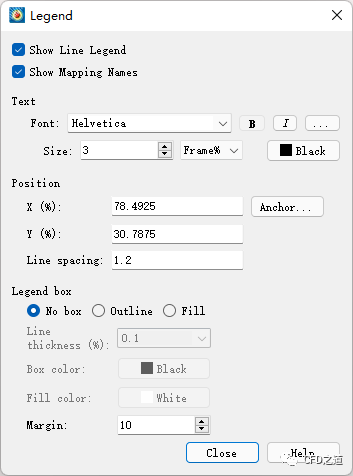
点击菜单Plot → Line Legend… 打开设置对话框
7 导出图形
-
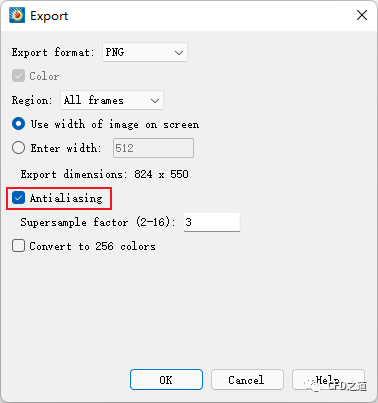
点击菜单File → Export… 打开图片输出对话框
最终导出的图形如下所示。
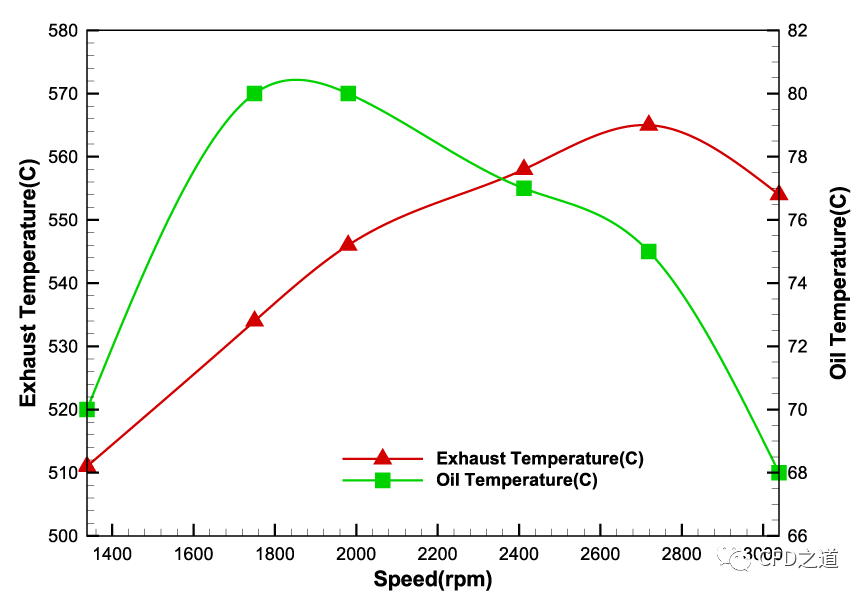
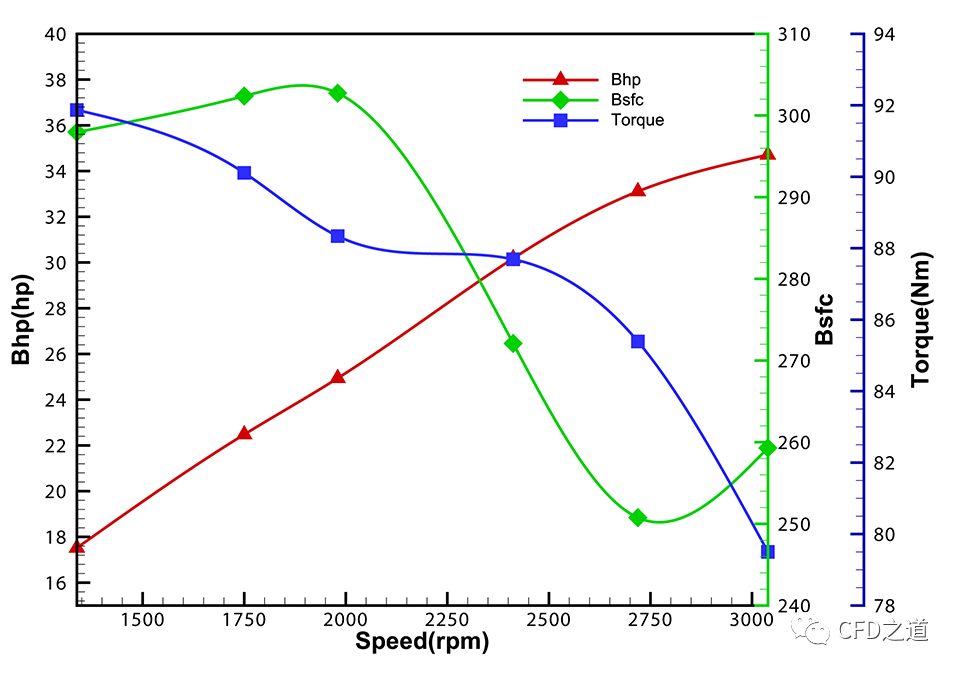
上面是双Y轴图。也可以根据相同的方法创建多Y轴图。
如利用下面的数据可以生成多Y轴图。
| Speed(rpm) | Bhp(hp) | Bsfc | Torque(Nm) |
|---|---|---|---|
| 1338 | 17.52 | 297.97 | 91.87 |
| 1750 | 22.48 | 302.38 | 90.11 |
| 1980 | 24.94 | 302.74 | 88.34 |
| 2412 | 30.18 | 272.09 | 87.69 |
| 2719 | 33.11 | 250.76 | 85.39 |
| 3039 | 34.71 | 259.29 | 79.5 |
生成图形如下图所示。
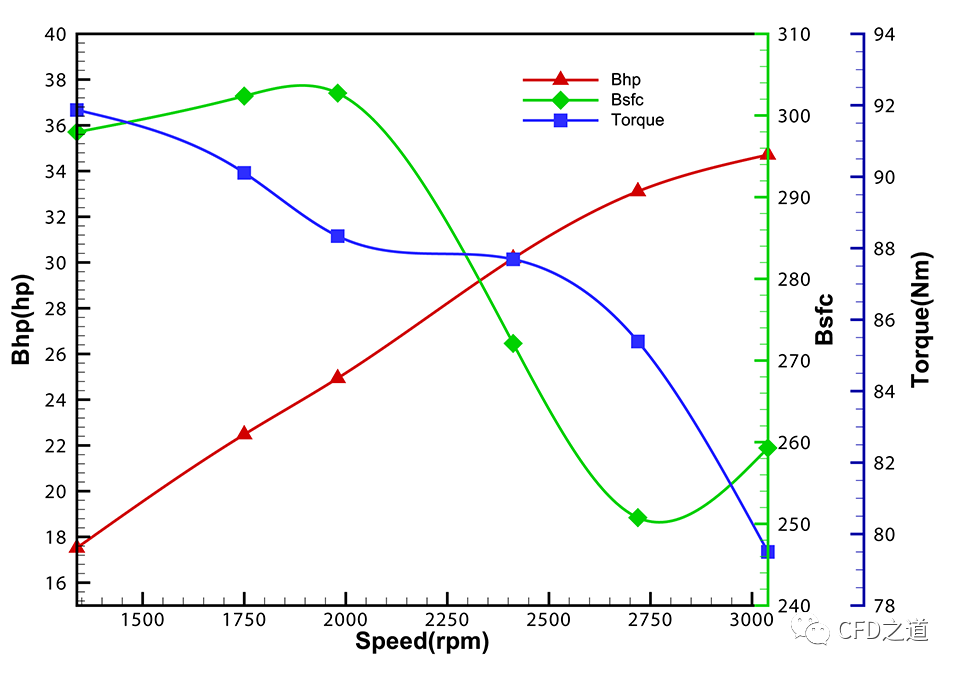
多Y轴图不利于数据查看,尽量少用。
(完)
本篇文章来源于微信公众号: CFD之道


评论前必须登录!
注册