
本算例演示利用STAR CCM+计算多孔介质问题。
1 模型描述
计算模型如下图所示。计算区域入口气体速度20 m/s,出口采用压力出口边界,静压为零。
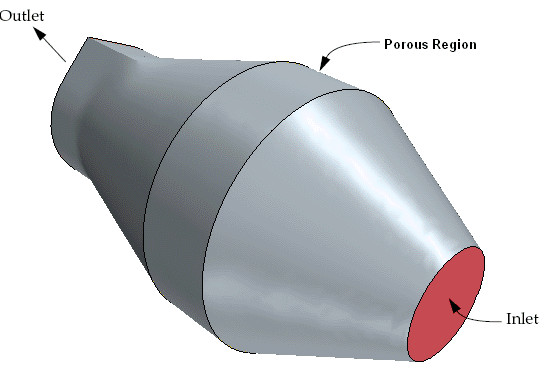
几何中心位置包含一个长度为0.03 m,直径0.1 m的圆柱形多孔介质区域。在多孔介质区域内,单位长度的 理论压降可以通过下式来计算:
式中,为通过介质的表观速度;为定义多孔阻力的系数,分别为惯性阻力系数与粘性阻力系数。
阻力系数通常利用试验值进行拟合。本算例中,,。
2 各向同性多孔介质计算
-
启动STAR CCM+并新建Simulation -
利用菜单File > Import > Import Volume Mesh导入计算网格catalyst.ccm -
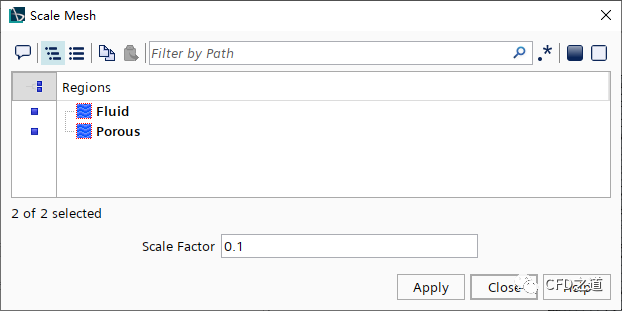
点击菜单Mesh > Scale Mesh,弹出对话框中指定 Scale Factor为0.1,点击Apply缩放网格
2.1 选择物理模型
-
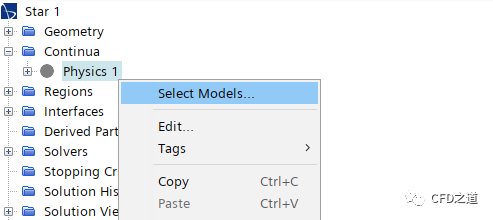
右键选择模型树节点Continua → Select Models… 打开模型选择对话框
-
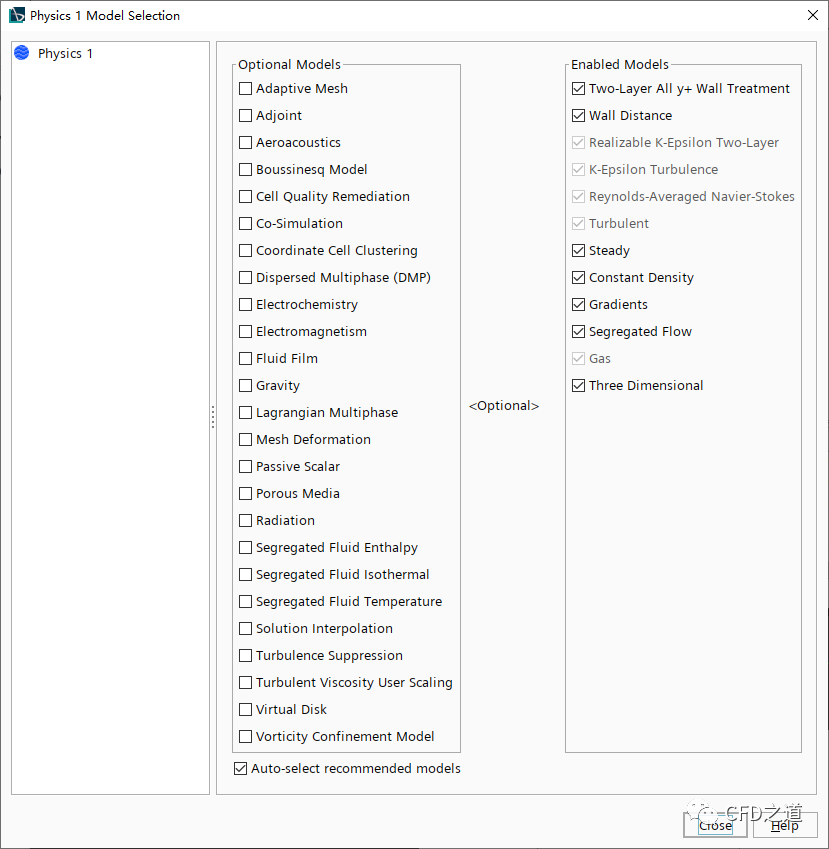
选择以下物理模型 -
Gas -
Segregated Flow -
Constant Density -
Steady -
Turbulent -
K-Epsilon
选择完毕后的模型对话框如下图所示。
2.2 边界条件设置
-
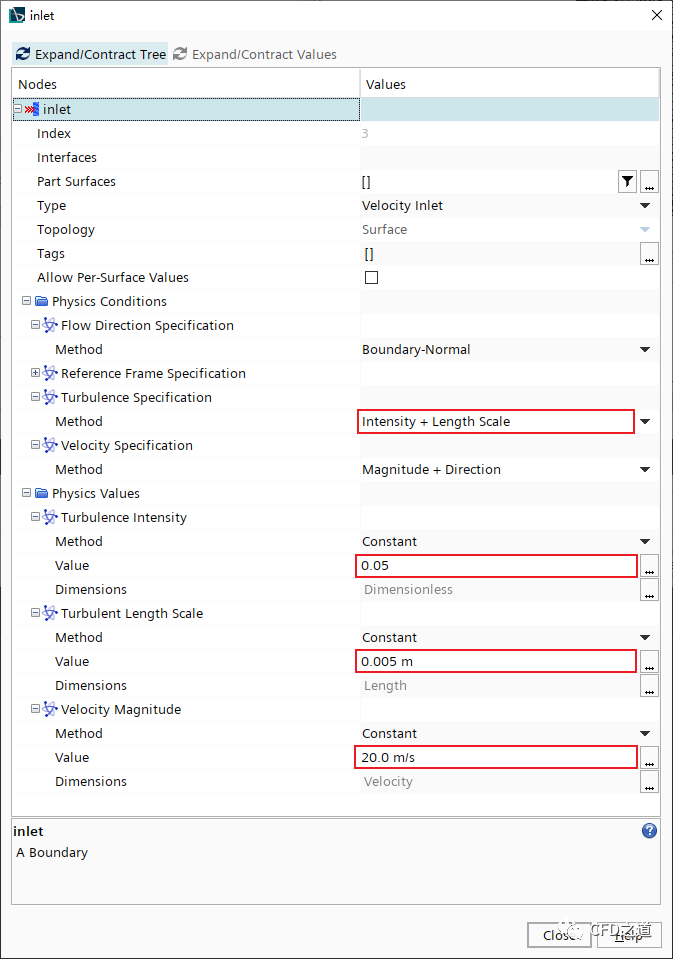
双击模型树节点Regions > Fluid > Boundaries > inlet,按下图所示设置参数 -
指定 Turbulence Specification方法为Intensity + Length Scale. -
指定Turbulence Intensity 为0.05 -
指定Turbulence Length Scale 为0.005 m -
指定Velocity Magnitude为20 m/s
2.3 指定多孔介质参数
-
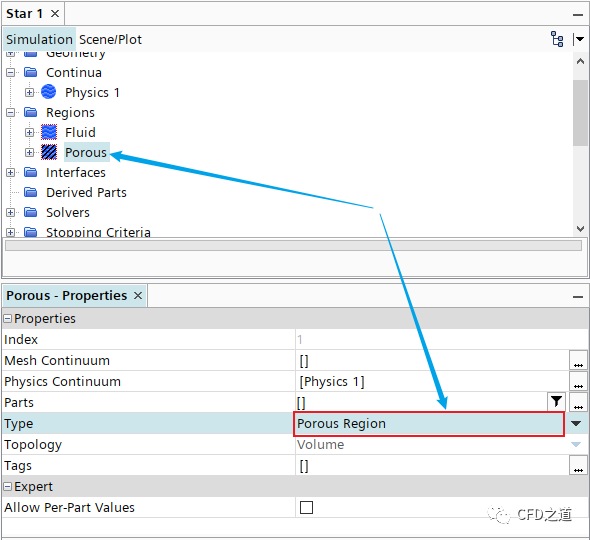
选中模型树节点Regions → Porous,设置其Type为Porous Region
-
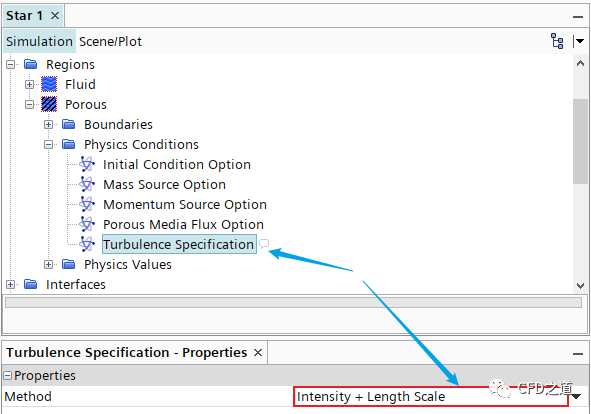
进入节点Porous > Physics Conditions,设置Turbulence Specification为Intensity+Length Scale
-
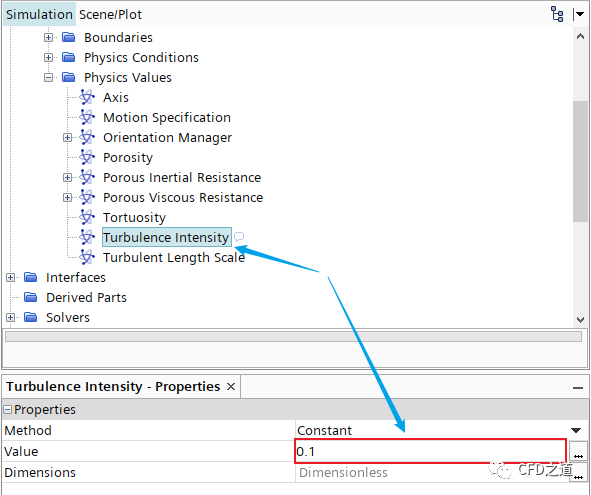
指定湍流强度为0.1
-
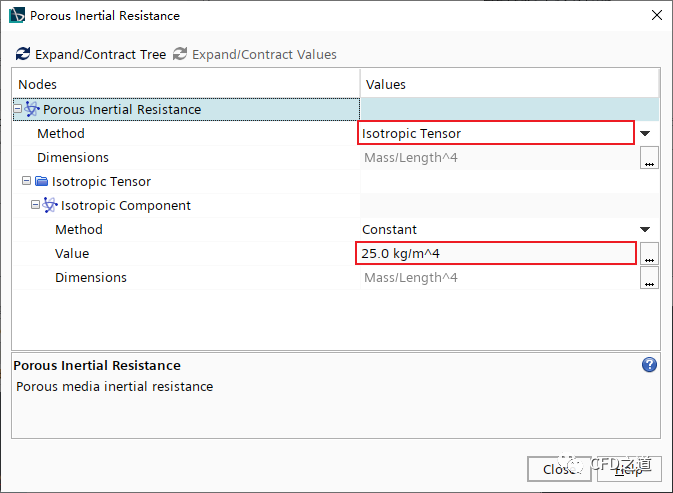
双击模型树节点Physics Values > Porous Inertial Resistance,弹出设置对话框 -
指定Method为Isotropic Tensor -
指定Value为25 kg/m^4
-
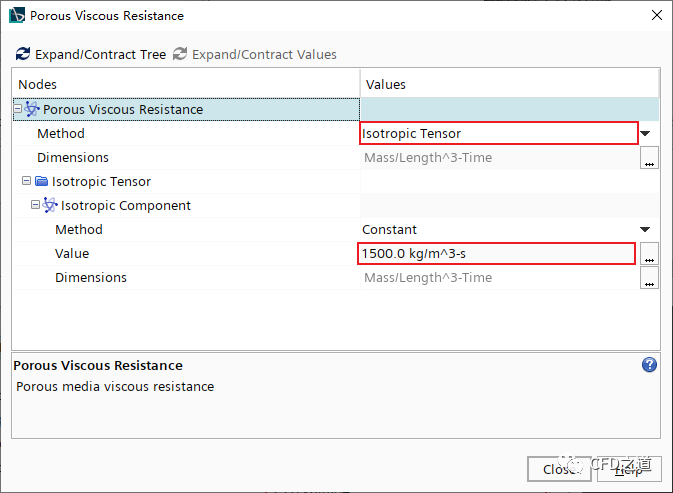
相同方式设置Porous Viscous Resistance节点 -
指定Method为Isotropic Tensor -
指定Value为1500 kg/m^3-s
2.4 监测物理量
监测多孔介质区域的上下游的压降。
-
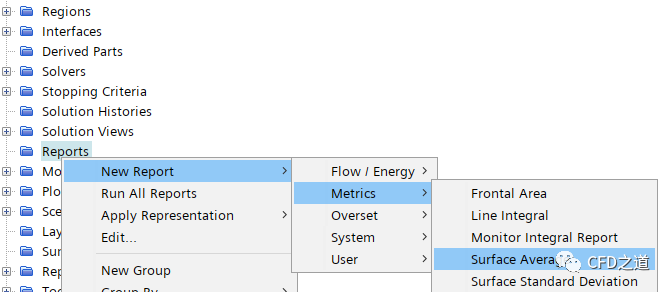
右键选择模型树节点Reports,选择New Report > Metrics > Surface Average
-
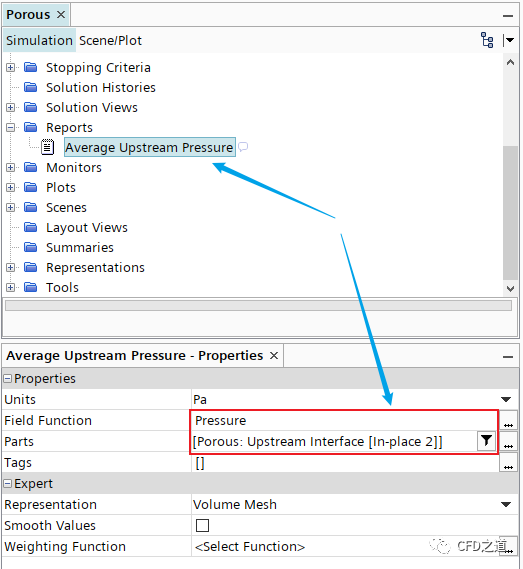
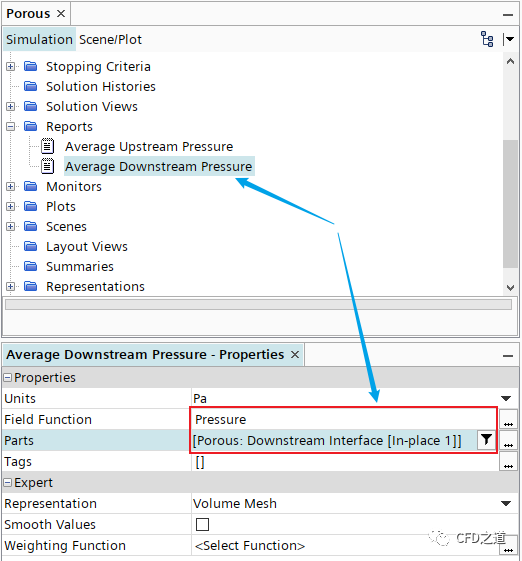
将新添加的节点Surface Average 1名称修改为Average Upstream Pressure -
修改节点Average Upstream Pressure中的内容,如下图所示
-
相同方式新建另一个面平均报告,命名为Average Downstream Pressure
-
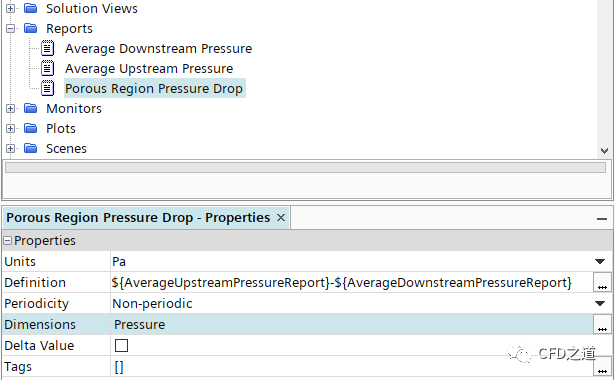
右键选择模型树节点Reports,点击菜单项New Report > User > Expression创建新的报告,修改名称为Porous Region Pressure Drop
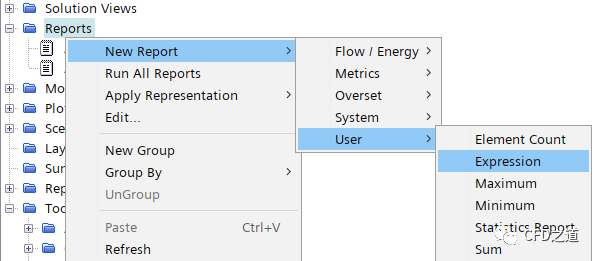
-
设置表达式定义为 $AverageUpstreamPressureReport - $AverageDownstreamPressureReport
-
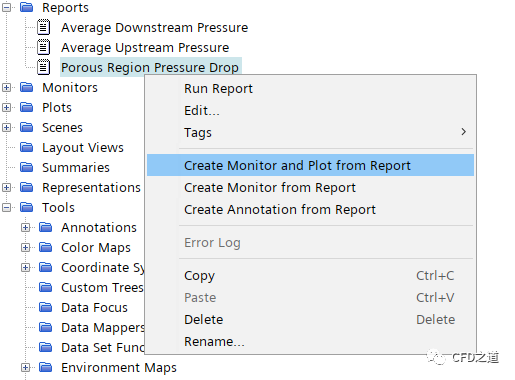
右键选择节点Porous Region Pressure Drop,点击弹出菜单项Create Monitor and Plot from Report
-
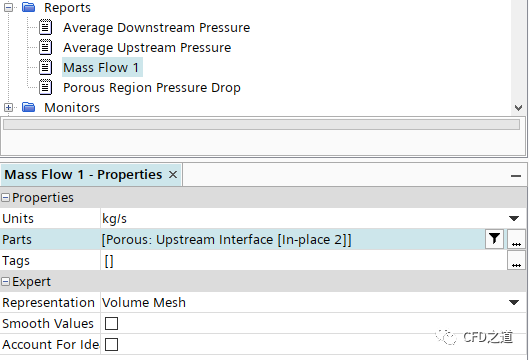
右键选择模型树节点Reports,点击菜单项New Report > Flow / Energy > Mass Flow创建Report
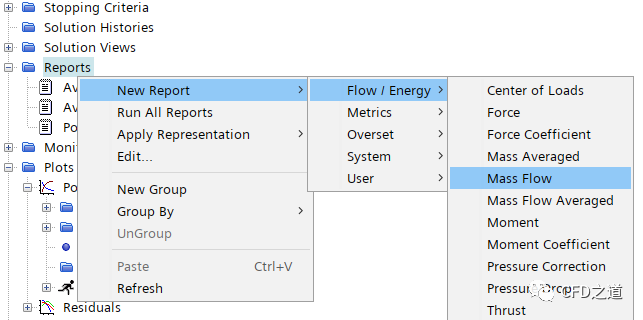
-
如下图所示设置质量流量报告的参数 -
设置Parts为Porous > Upstream Interface [In-place 2]
-
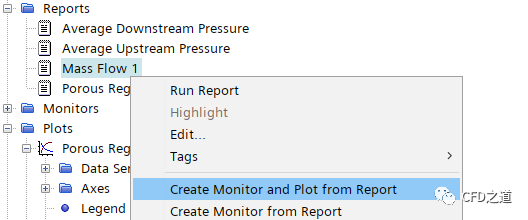
右键选择节点Mass Flow 1,点击菜单项Create Monitor and Plot from Report创建绘图
2.5 设置终止标准
-
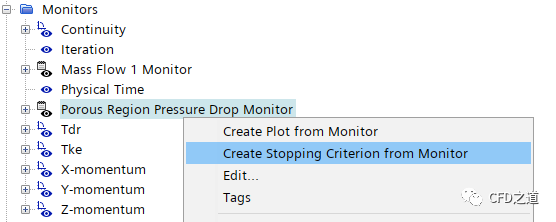
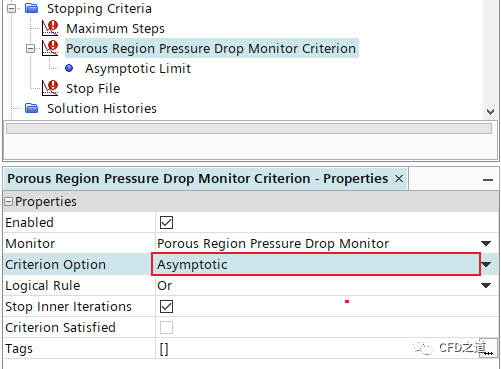
鼠标右键选择模型树节点Monitors > Porous Region Pressure Drop Monitor,点击弹出菜单项Create Stopping Criterion from Monitor
-
如下图所示设置Criterion Option为Asymptotic
-
设置参数为0.02
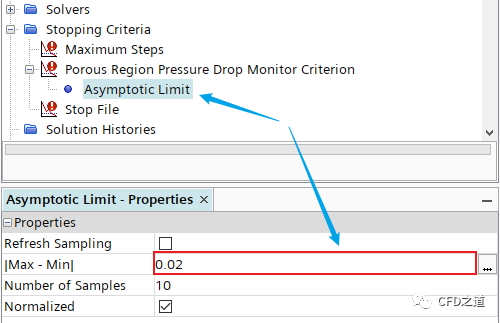
采用此限制条件后,求解计算进行过程中,当多孔区域压降监视器中的变化在连续10次迭代中的范围小于0.02Pa时,计算会自动停止。由于上游界面上的压力预计约为100Pa,这应该仅在求解实际上达到收敛时才会发生。
2.6 计算求解
-
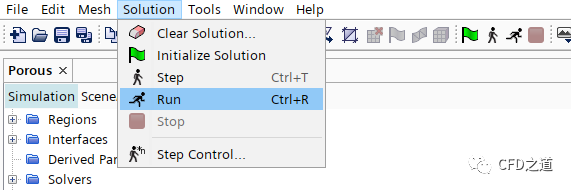
点击菜单Solution → Run开始计算
2.7 计算结果
-
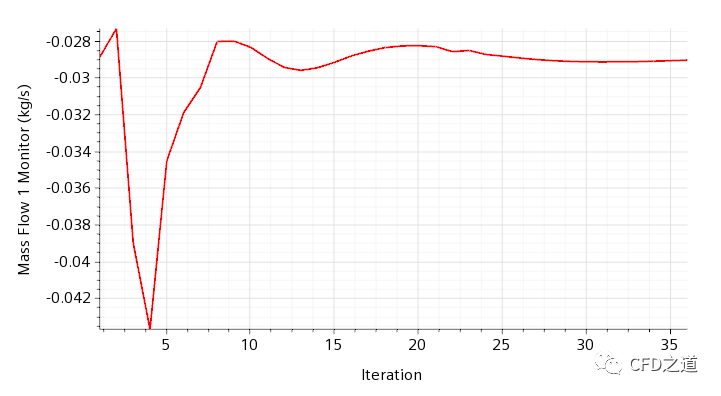
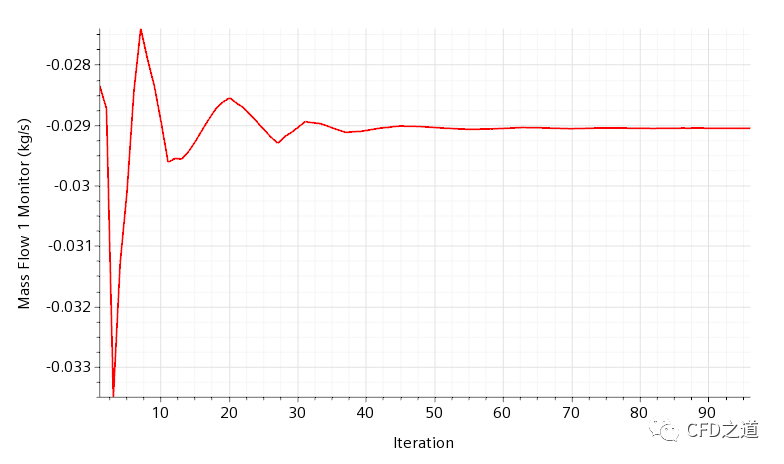
监测到的流量随迭代变化
-
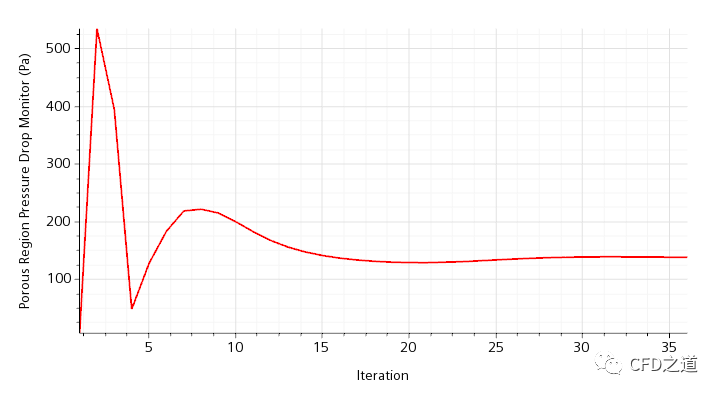
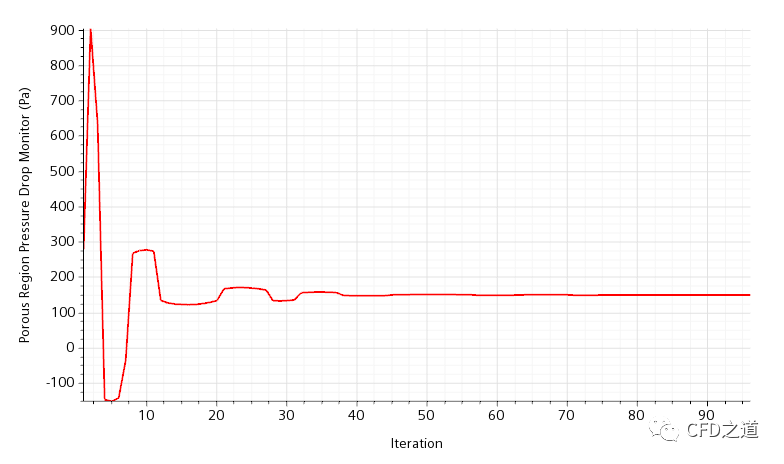
压降随迭代变化
-
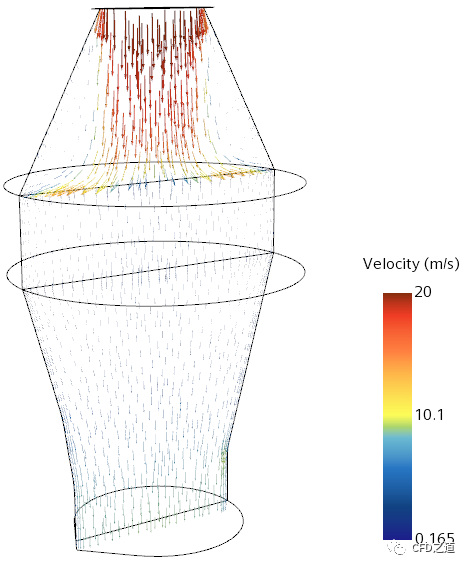
中面上的速度矢量图
-
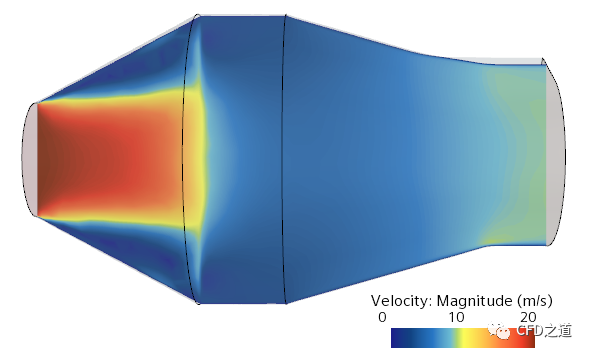
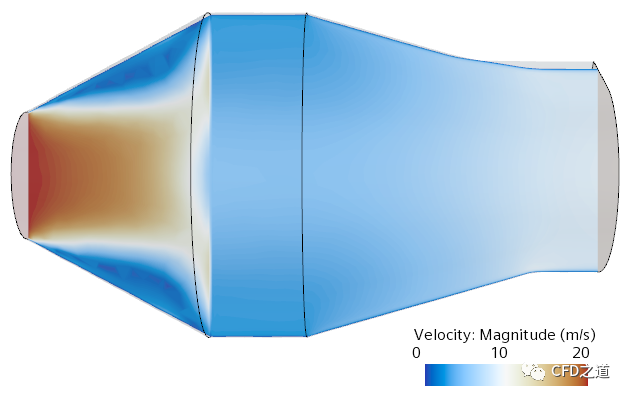
中面上的速度分布
3 各向异性多孔介质计算
多孔介质的阻力系数有时是各向异性的,即其沿某一方向具有与其他方向存在数量级上差异的阻力系数。
下面演示当流动主要沿Y轴方向流动时,通过为横流方向,X方向与Z方向,指定较大的惯性阻力与粘性阻力来体现各向异性多孔介质。如惯性阻力系数为:
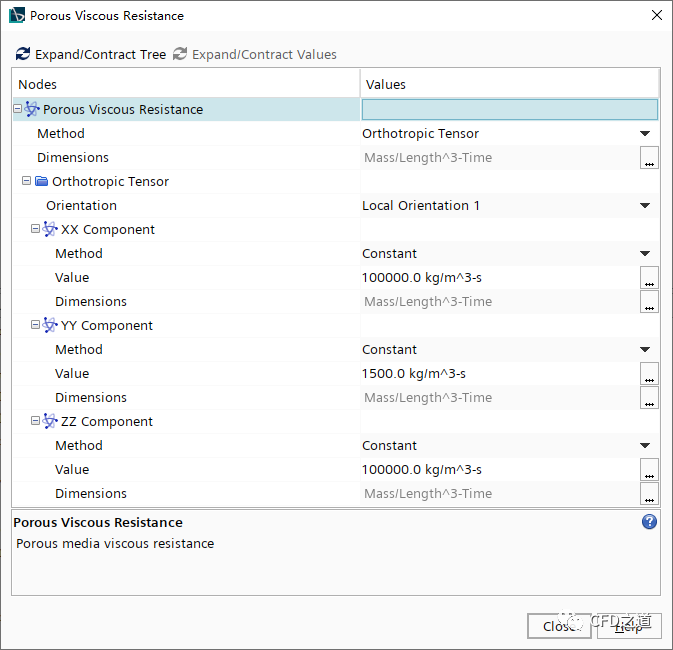
粘性阻力系数为:
在前面的基础上进行修改。
-
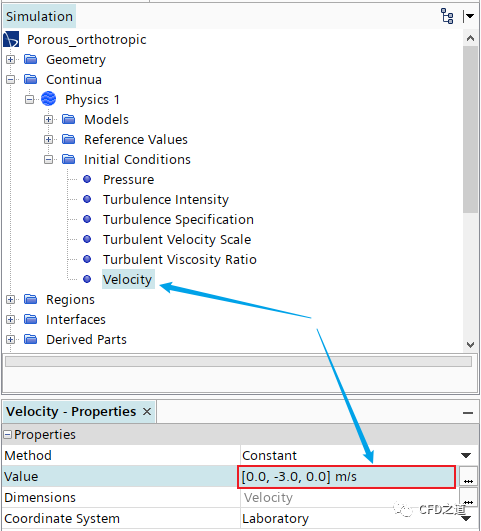
点击菜单项File > Save As,指定文件名称为orthotropicPorousMedia -
选中模型树节点Continua > Physics 1 > Initial Conditions > Velocity,设置参数速度为**[0 -3 0]**
3.1 指定阻力系数
-
Regions > Porous > Physics Values > Porous Interial Resistance
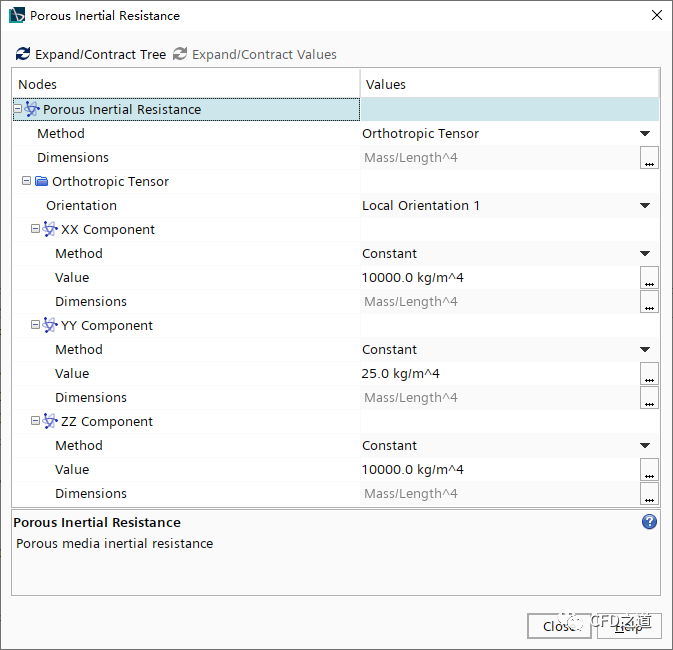
-
双击节点Porous Viscous Resistance
3.2 进行计算
-
点击菜单Solution → Clear Solution…及Initialize Solution… 清除数据并初始化 -
点击菜单Solution → Run开始计算

3.3 计算结果
-
流量监测结果
-
压降监测结果
-
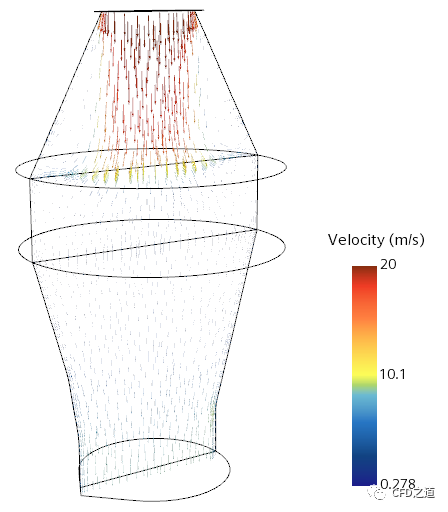
速度矢量分布
-
速度分布云图
-
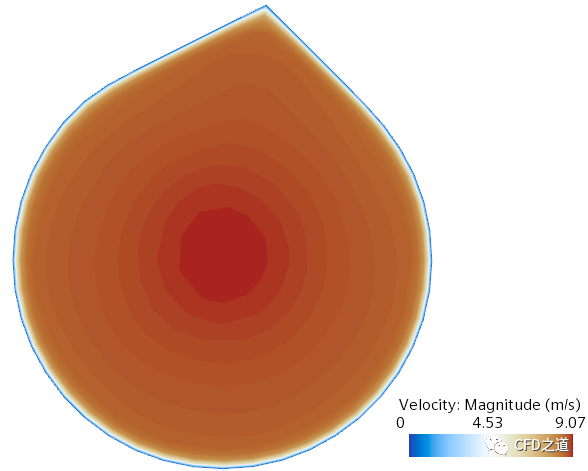
出口面上速度分布
-
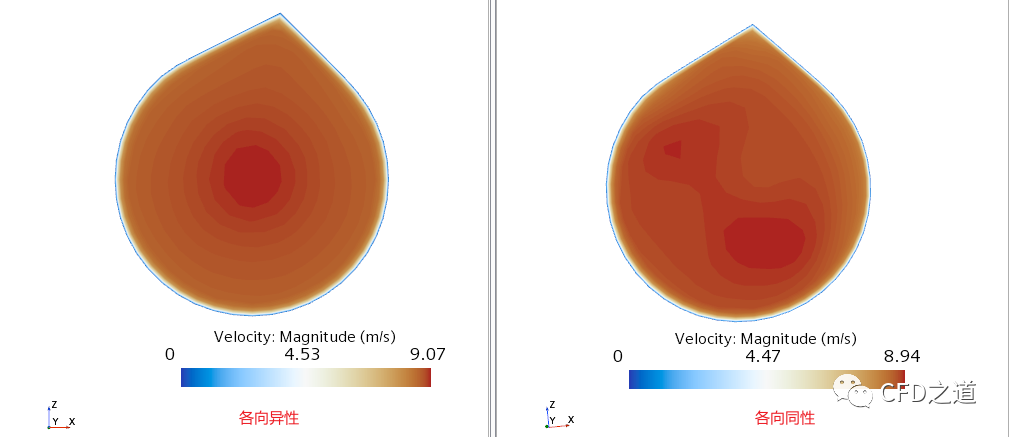
与各向同性阻力计算结果比较
注:本算例取自STAR CCM+随机案例文档。留存备查阅。
”
本篇文章来源于微信公众号: CFD之道


评论前必须登录!
注册