
本文介绍gnuplot中绘制二维曲线图的一些基本流程与参数设置。
gnuplot绘制曲线图包括两类:
-
函数绘图。指定函数定义区域,绘制函数曲线 -
数据绘图。读入数据文件,绘制数据分布曲线
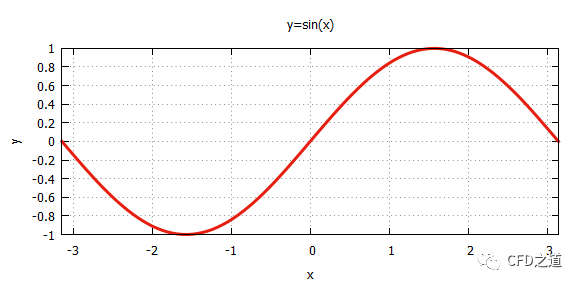
二维曲线图是最简单,也是最常用的图形形式,常用于表达两个物理量之间的变换规律。如下面的图形反映了纵坐标y与横坐标之间成正弦函数规律。
绘制一条二维曲线图通常需要两列数据,这些数据可以是函数计算的结果,也可以是离散的点。
1 函数绘图
利用函数进行绘图非常简单,只需要使用命令plot即可,如绘制正弦函数图形,可以使用命令:
plot sin(x)
当然可以指定函数的作用区域,如指定x轴范围为[-pi : pi]:
plot [-pi : pi] sin(x)
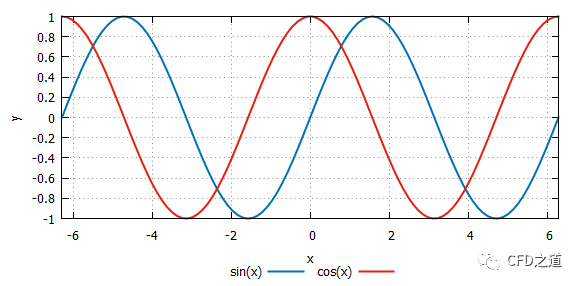
也可以生成多个函数,如将正弦函数和余弦函数同时绘制在图形上:
plot [-2*pi : 2*pi] sin(x),cos(x)
生成图形如下图所示。
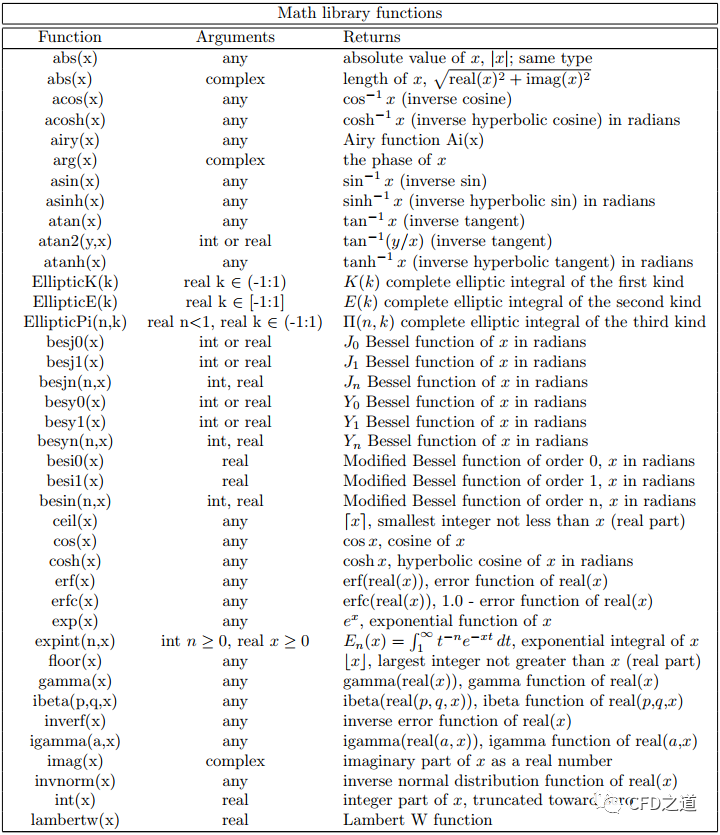
gnuplot内置了一些特殊的数学函数,在图形绘制时可以直接使用。这些函数如下表所示。
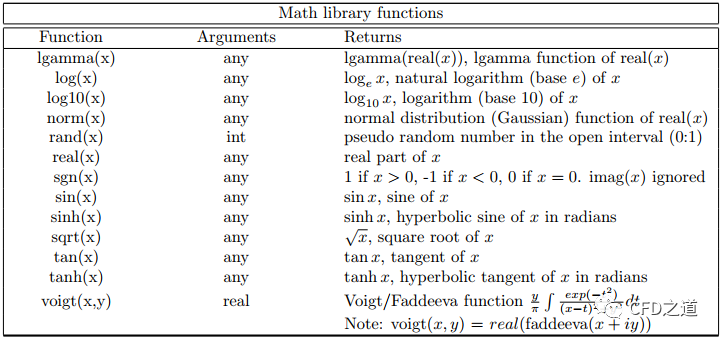
除此之外,还有一些特殊函数:
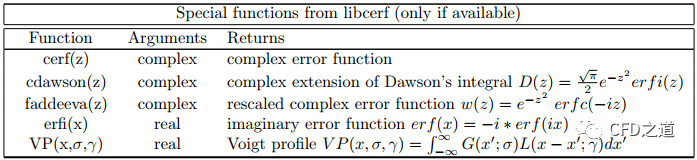
更多关于函数的内容描述可参阅gnuPlot用户手册。
2 数据绘图
gnuplot还支持绘制离散数据图像。在绘制离散图像之前,需要先准备数据文件。
gnuplot绘制离散数据图形的格式为:
plot '' {binary }
{{nonuniform} matrix}
{index | index "" }
{every }
{skip }
{using }
{smooth 使用过程中包含一些修饰词:binary、index、every、skip、using、bin以及smooth。
-
skip N:告诉程序忽略输入文件开头的N行 -
binary:表示文件包含二进制数据 -
index:选择要绘制多数据集文件中的哪些数据集 -
every:指定一个数据集内的哪些点要绘制 -
using:指定文件中的哪些列以何种顺序使用 -
smooth:执行简单的过滤、插值, 或者在绘制之前对数据进行曲线拟合 -
bin:将单个输入点沿x方向分成大小相等的区间,并绘制每个区间的单个累积值 -
volatile:表示文件的内容可能无法在后面重新读取,因此应该保留在内部以供重复使用。
如有下面的数据文件temp.dat:
# 月份 降水量(mm) 温度(℃)
# =========================
1     2.5     -4
2     5.1     -2
3     10.2     6
4     25.4     13
5     27.9     20
6     71.1     24
7     175.3     26
8     182.9     25
9     48.3     20
10     17.8     13
11     5.1     5
12     2.5     -2
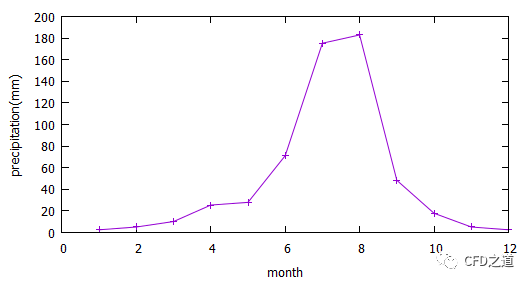
利用gnuplot绘制降水量随月份的变化曲线,可以使用:
set xlabel "month"
set ylabel "precipitation(mm)"
unset key
plot "temp.dat" using 1:2 with linespoints
此时绘制图形如下图所示:
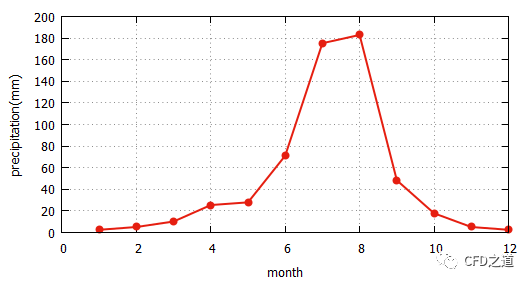
若觉得图形不够美观,可以使用修饰:
plot "temp.dat" using 1:2 with linespoints lw 2 ps 1 pt 7 lc 7
关于修饰词的解释,后面再进行描述。这里若提示找不到文件,可以使用文件的绝对路径。using 1:2表示使用文本数据中的第一列与第二列;with linespoints表示使用带标记符号的线条进行曲线绘制。
绘制完成的图形如下图所示。
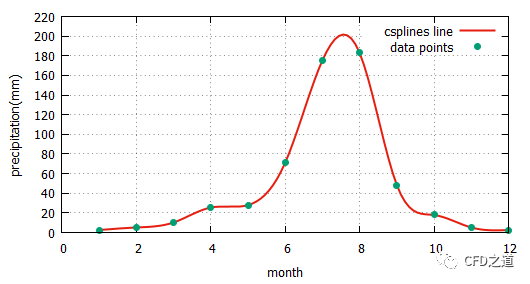
有时想得到光顺的曲线,此时可以使用smooth修饰。
plot 'temp.dat' u 1:2 smooth csplines lw 2 lc 7 t 'csplines line','temp.dat' u 1:2 w points pt 7 t 'data points'
图形如下图所示。
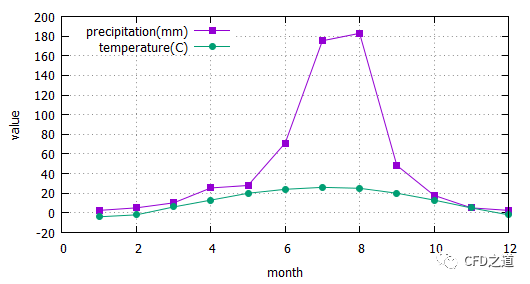
那如果要将多列数据放到一个图上,可以使用下面的命令:
plot 'temp.dat' u 1:2 w lp pt 5 t 'precipitation(mm)','temp.dat' u 1:3 w lp pt 7 t 'temperature(C)'
输出图像如下图所示:
3 图形样式
前面的示例也可以看出来,在绘制图形的过程中,我们加入了大量的图形修饰词,这些修饰词用于控制图形的样式。
gnuplot里面有几个控制点和线画法风格的参数:
-
linetype:线条类型 -
linewidth:线条粗细 -
linecolor:线条颜色 -
pointtype:数据点的类型 -
pointsize:数据点的尺寸
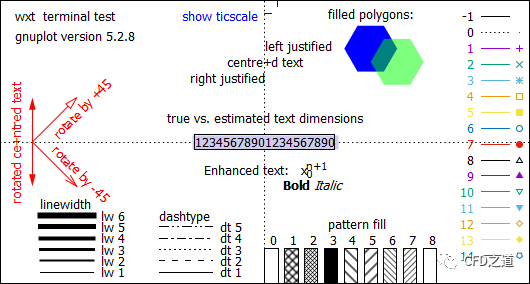
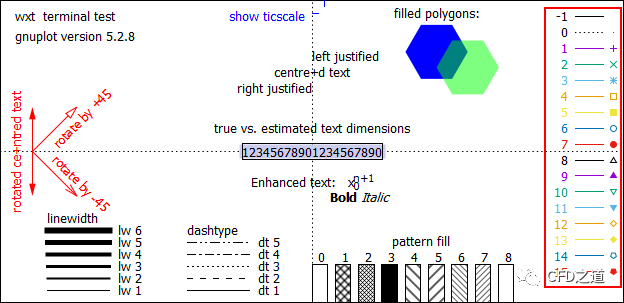
可以在gnuplot中输入命令test,此时输出如下图所示的信息,其中包含了绘图中的一些修饰信息。
3.1 线条类型
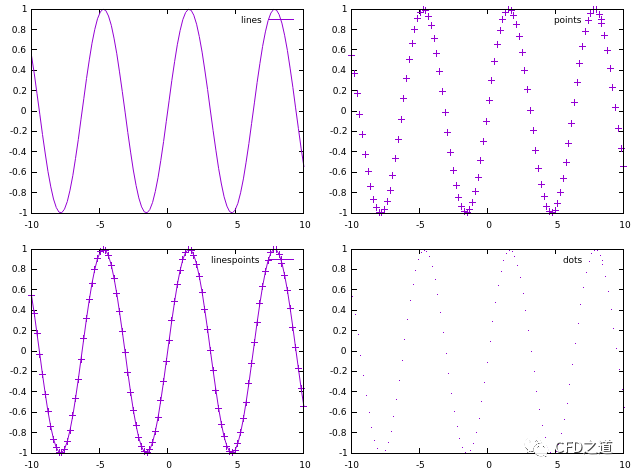
线条类型可以使用修饰词with来进行指定,常用的线条类型包括:lines、points、linespoints、dots等。
set multiplot layout 2,2
plot sin(x) with lines
plot sin(x) with points
plot sin(x) with linespoints
plot sin(x) with dots
unset multiplot
如下图所示。
3.2 线条粗细
线条粗细使用修饰词linewidth或lw来指定。
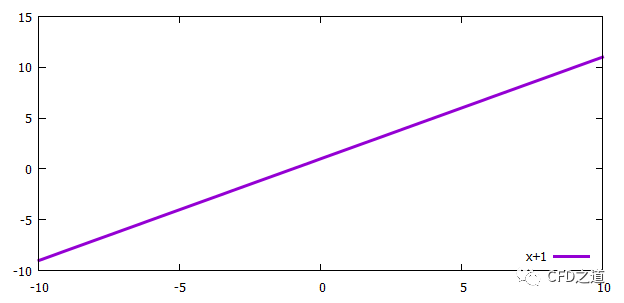
如用下面的命令绘制一条指定线宽为3的曲线:
plot x+1 lw 3
生成图形如下图所示。
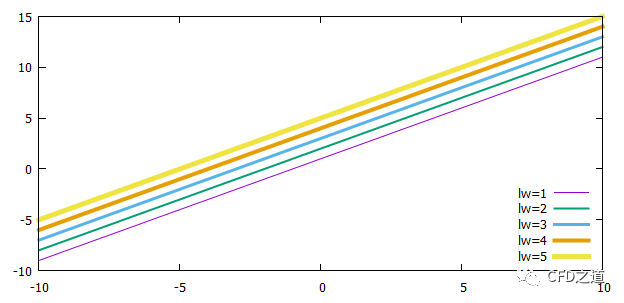
下面用绘制不同宽度的曲线,感受一下线宽。
plot x+1 lw 1 t "lw=1", x+2 lw 2 t "lw=2", x+3 lw 3 t "lw=3", x+4 lw 4 t "lw=4",x+5 lw 5 t "lw=5"
set key right bottom
replot
生成图像如下图所示。
3.3 线条颜色
线条颜色使用修饰词linecolor或lc进行指定。颜色可以使用gnuplot内置代码或rgb颜色。
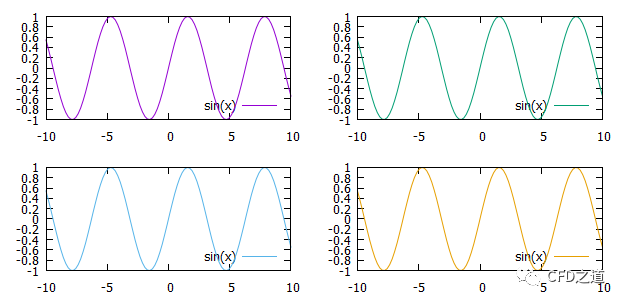
如利用下面的命令显示不同颜色的函数图形:
set multiplot layout 2,2
plot sin(x) lc 1
plot sin(x) lc 2
plot sin(x) lc 3
plot sin(x) lc 4
unset multiplot
分别显示了内置颜色代码为1,2,3,4时的函数图形。
颜色代码对应的颜色,可以在利用test命令显示的信息中找到,如下图所示的红色框选位置。
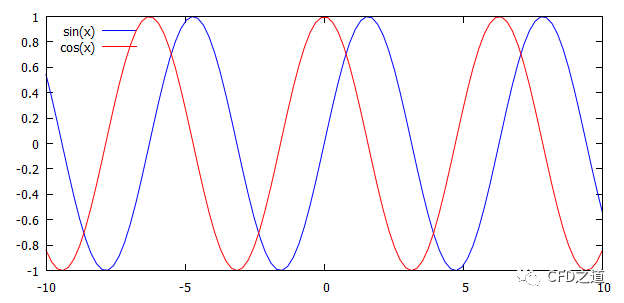
gnuplot也支持利用rgb颜色代码定义线条颜色,此时可以使用rgb关键词。
如下面的命令:
plot sin(x) lc rgb "blue",cos(x) lc rgb "#ff0000"
分别用蓝色与红色显示正弦与余弦曲线,如下图所示。
3.4 数据点类型与尺寸
数据点的类型在test面板中可以找到,下图所示的红色框选位置为内置数据点类型代号。

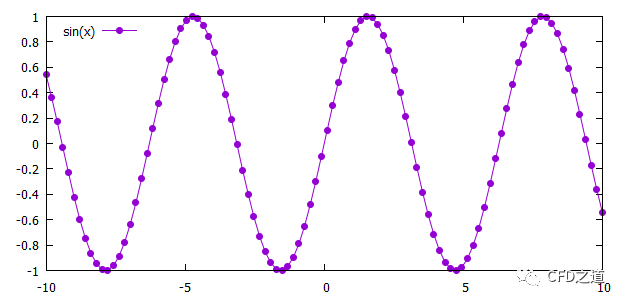
数据点类型使用修饰词pointtype或pt进行指定。如下面的命令使用代号为7的数据点类型:
plot sin(x) w linespoints pt 7
生成的图形如下图所示。
数据点的尺寸可以使用修饰词pointsize或ps进行指定。如下面的命令指定数据点尺寸为2。
plot sin(x) w linespoints pt 7 ps 2
生成的图像如下图所示。
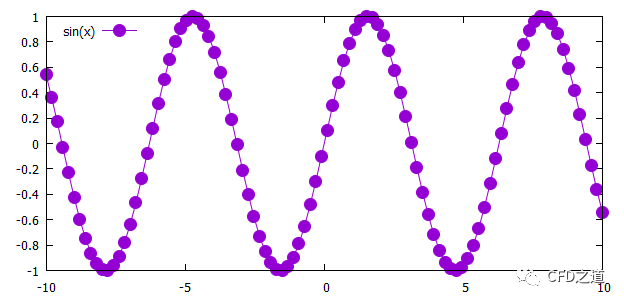
一般情况下不用修改数据点的大小。
4 图形元素
图形元素包括坐标轴、图题、图例等信息。可以指定坐标轴的分布范围。下面的命令生成一个函数图像。
plot sin(x) lc 7 lw 2
图像如下图所示。
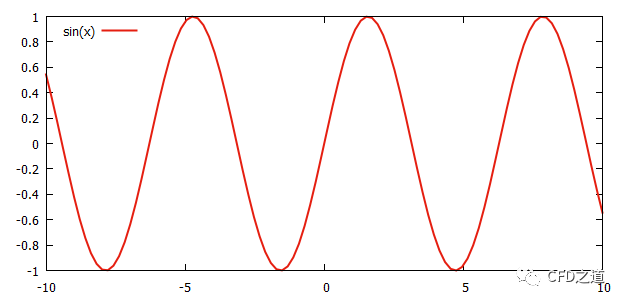
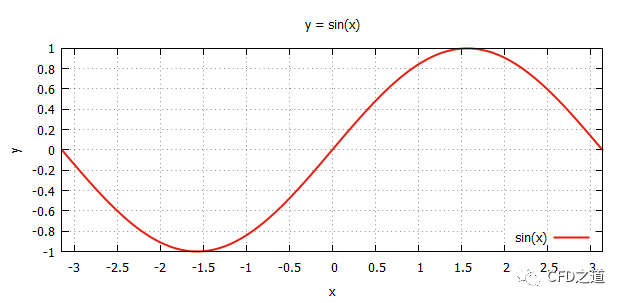
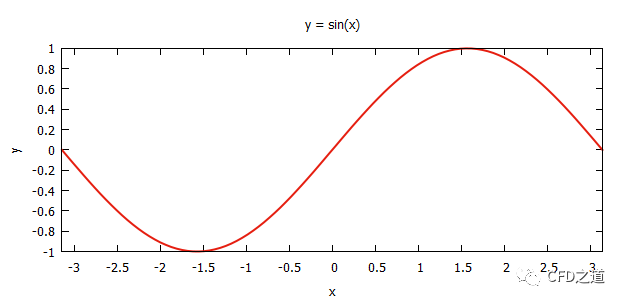
默认情况下有图例,但没有x、y轴的信息。可以利用以下命令指定坐标轴信息:
set xrange [-pi : pi]     # 指定x轴范围
set xtics -4,0.5,4          # 指定x轴标签
set ytics -1,0.2,1        # 指定y轴标签
set title "y = sin(x)"     # 指定图形标签
set grid                # 打开格栅
set key right bottom     # 指定图例位置在右下角
replot                    #重新绘制图形
生成图像如下图所示。
若有选项不想使用,可以使用unset取消设置,如:
unset grid        # 取消格栅显示
unset key        # 取消图例显示
replot            # 重绘图形
函数图像变为下面的形式:
本篇文章来源于微信公众号: CFD之道


评论前必须登录!
注册