圆柱绕流问题似乎成了所有CFD软件案例中的必备案例。本次利用XFlow软件来实现此案例。
注:Xflow是Next Limit科技公司开发的新一代计算流体动力学(CFD)软件,目前已被达索收购。其基于粒子的完全拉格朗日函数方法,可以用于处理复杂的流动问题,如空气动力学、航空声学、运动部件、自由表面流动以及流固耦合问题。
1 问题描述
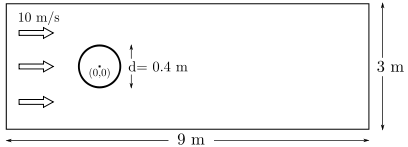
本案例计算雷诺数4000条件下流体流经圆柱后的流场分布。本案例采用2D模型计算。案例几何如图所示。
通过本案例主要练习的内容包括:
-
创建新的工程
-
创建简单的几何
-
熟悉XFlow的工作界面
-
建立虚拟风洞模型
-
设置材料参数及边界条件
-
进行仿真计算
-
仿真后处理
2 启动XFlow
XFlow安装完毕后,windows下可以在桌面上双击XFlow快捷图标进入XFlow。
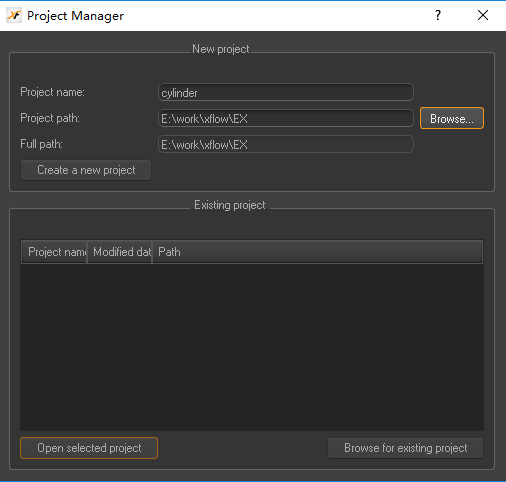
XFlow启动后会要求用户指定工程信息(工程名称、文件保存路径等),信息指定完毕后点击按钮Create a new project创建工程
3 创建几何
本案例的几何模型采用XFlow直接创建。XFlow提供了一些简单的几何创建功能。
创建一个底面圆半径0.2m,高1m的圆柱。
-
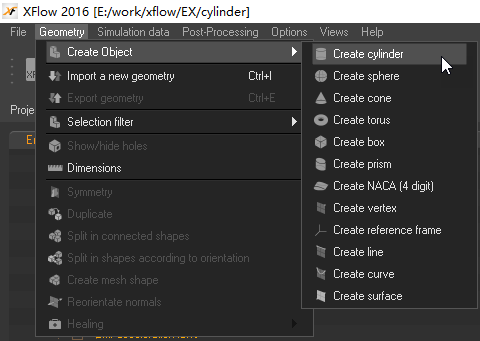
利用菜单Geometry > Create object > Create cylinder弹出创建圆柱对话框
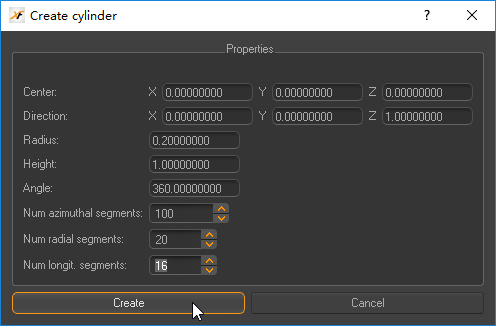
在弹出的菜单中进行如下图所示设置。
-
设置Direction为(0 0 1),设置Radius为0.2,设置Height为1,点击Create按钮创建圆柱体
4 仿真模型
本案例是典型的外流场仿真问题。
4.1 Engine设置
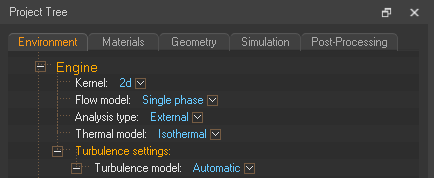
配置树形菜单Project Tree > Environment > Engine,进行如下设置:
-
Kernel : 2d
-
Flow model: Single phase
-
Analysis type: External
-
Thermal model: Isothermal
-
Turbulence settings:
-
Turbulence model: Automatic
4.2 Environment设置
-
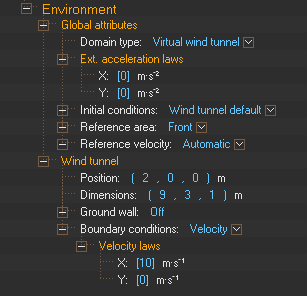
Global attributes > Domain type: Virtual wind tunnel
-
Global attributes > Ext. acceleration laws:保持其值为0
-
Global attributes > Initial conditions: Wind tunnel default
-
Global attributes > Reference area: Front
-
Global attributes > Reference velocity: Automatic
-
Wind tunnel > Position: 设置为(2 0 0)
-
Wind tunnel > Dimensions: 设置为(9 3 1)
-
Wind tunnel > Ground wall: Off
-
Wind tunnel > Boundary conditions: Velocity
-
Wind tunnel > Boundary conditions > Velocity law: 10 m/s
注意:在XFlow的虚拟风动中,默认流动方向是从-X方向流往+X方向。
4.3 材料设置
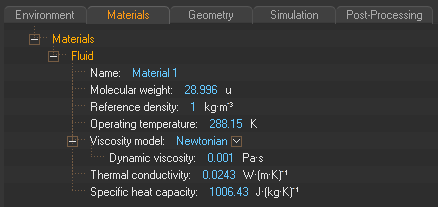
修改Materials标签页下的材料参数。
-
Project Tree > Materials > Fluid > Density : 1 kg·m-3
-
Project Tree > Materials > Fluid > Viscosity model: Newtonian
-
Project Tree > Materials > Fluid > Viscosity model > Dynamic viscosity: 0.001 Pa·s
4.4 仿真参数设置
-
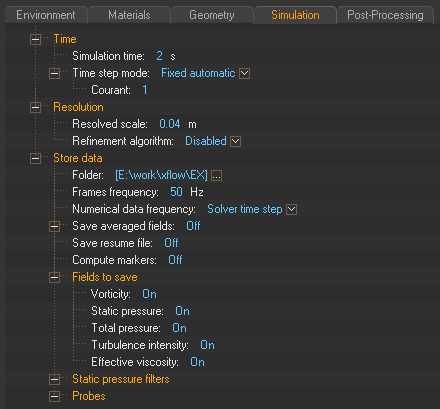
Time > Simulation time: 2 s
-
Time > Time step mode: Fixed automatic
-
Time > Time step mode > Courant: 1
-
Resolution > Resolved scale: 0.04 m
-
Resolution > Refinement algorithm: Disabled
其他参数保持默认,如下图所示。
5 求解计算
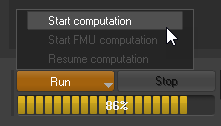
点击左下角按钮Run> Start computation进行求解计算。视计算机能力的不同,可能会持续几分钟到几十分钟。
6 后处理
可以查看切面上物理量分布以及定义监测点位置的物理量随时间分布。
6.1 切平面速度
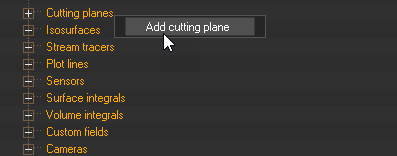
选择Post-Processing标签页,右键选择树形节点Cutting Planes,选择菜单Add cutting plane
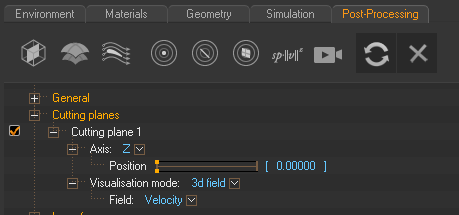
在新增的Cuttin Plane 1节点下设置Axis为Z,设置Field为Velocity
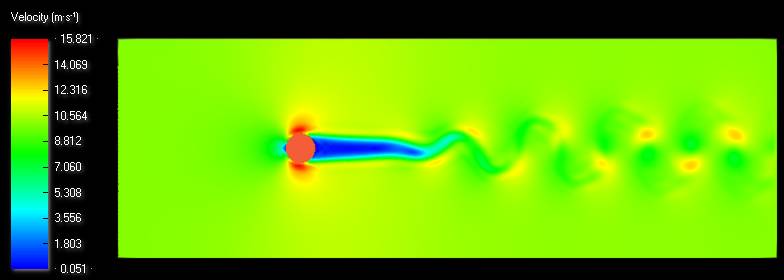
速度分布如下图所示。
6.2 创建检测点
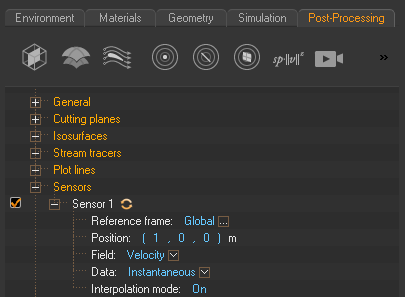
利用菜单Post-processing > Sensors创建检测点,在树形菜单中设置该监测点坐标为(1 0 0),如下图所示。
选择Field为默认的Velocity,点击Sensor1右侧的更新按钮。
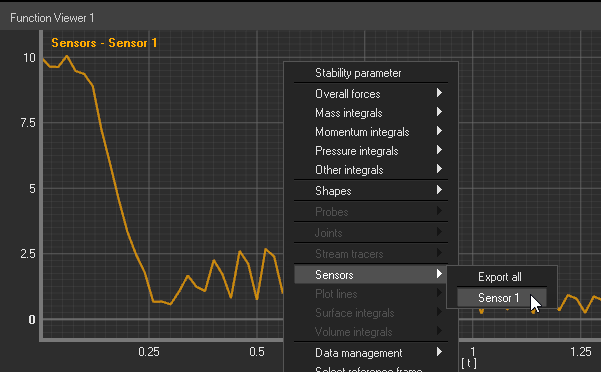
此时可以在Function Viewer窗口中点击右键,选择菜单Sensors > Sensor 1,查看该监测点位置速度随时间变化曲线。
6.3 计算升阻力系数
可以很方便的在Function Viewer窗口中查看升阻力系数及升力阻力。
-
阻力系数: Function Viewer > Shapes > Cylinder > Cx
-
升力系数: Function Viewer > Shapes > Cylinder > Cy
-
阻力:Function Viewer > Shapes > Cylinder > Fx
-
升力:Function Viewer > Shapes > Cylinder > Fy
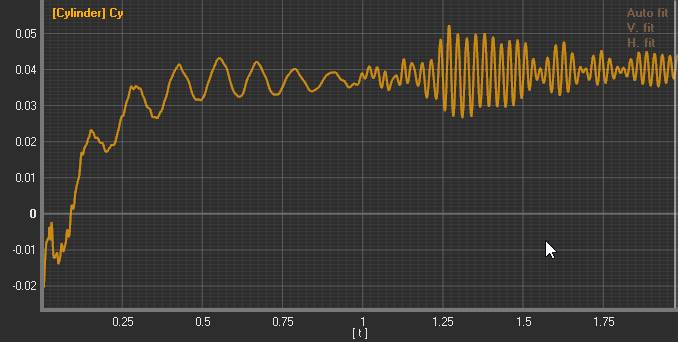
如下图所示为升力系数。
本案例至此结束。


本篇文章来源于微信公众号: CFD之道


评论前必须登录!
注册