Poisson方程的表达式为:
与Laplace方程不同,Poisson方程带有源项。
1 方程离散
Poisson的离散方式与Laplace方程类似:
改成迭代式形式为:
2 初始值与边界值
假设计算区域初始条件下。四个边界上。
对于源项,其值为:
3 计算代码
using PyPlot
matplotlib.use("TkAgg")

nx = 50
ny = 50
nt = 100
xmin = 0
xmax = 2
ymin = 0
ymax = 1

dx = (xmax - xmin) / (nx - 1)
dy = (ymax - ymin) / (ny - 1)


# 初始化
p = zeros((ny, nx));
b = zeros((ny, nx));
x = range(xmin, xmax, length = nx);
y = range(xmin, xmax, length = ny);

# 源项
b[floor(Int, ny / 4), floor(Int, nx / 4)] = 100;
b[floor(Int, 3 * ny / 4), floor(Int, 3 * nx / 4)] = -100;

function plot2D(x, y, p)
    fig = PyPlot.figure(figsize=(11,7), dpi=100)
    ss = PyPlot.surf(x,y,p, rstride=1, cstride=1, cmap=ColorMap("coolwarm"),
            linewidth=0)
    xlim(0,2)
    ylim(0,1)
    PyPlot.show()
end
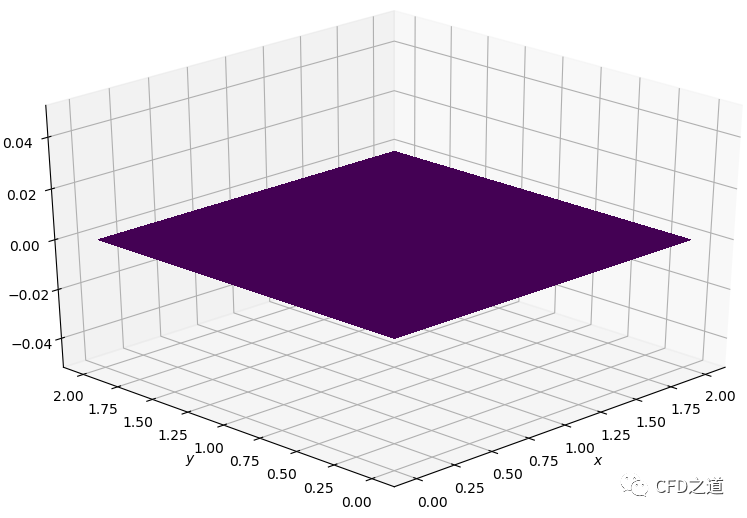
查看初始值分布。
plot2D(x,y,p)
初始分布如下图所示。

迭代计算代码如下。
for it in 1:nt
    pd = copy(p)
    p[2:end-1,2:end-1] = ((pd[2:end-1,3:end] + pd[2:end-1,1:end-2])*dy^2 +
        (pd[3:end,2:end-1]+pd[1:end-2,2:end-1])*dx^2 -b[2:end-1,2:end-1]*dx^2*dy^2)/(2*(dx^2+dy^2))

    p[1,:] .= 0
    p[ny,:] .= 0
    p[:,1] .= 0
    p[:,nx] .= 0
end
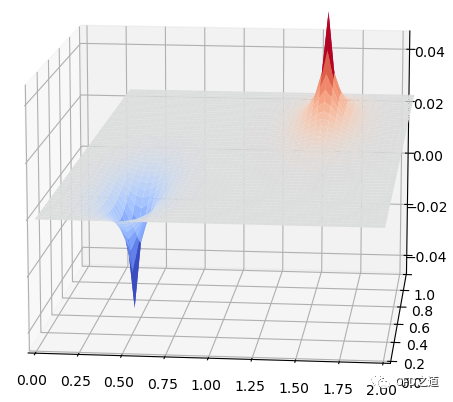
计算结果如下图所示。

完整代码如下。
using PyPlot
matplotlib.use("TkAgg")

nx = 50
ny = 50
nt = 100
xmin = 0
xmax = 2
ymin = 0
ymax = 1

dx = (xmax - xmin) / (nx - 1)
dy = (ymax - ymin) / (ny - 1)

# 初始化
p = zeros((ny, nx));
b = zeros((ny, nx));
x = range(xmin, xmax, length = nx);
y = range(xmin, xmax, length = ny);

# 源项
b[floor(Int, ny / 4), floor(Int, nx / 4)] = 100;
b[floor(Int, 3 * ny / 4), floor(Int, 3 * nx / 4)] = -100;
plot2D(x, y, p)

for it in 1:nt
    pd = copy(p)
    p[2:end-1,2:end-1] = ((pd[2:end-1,3:end] + pd[2:end-1,1:end-2])*dy^2 +
        (pd[3:end,2:end-1]+pd[1:end-2,2:end-1])*dx^2 -b[2:end-1,2:end-1]*dx^2*dy^2)/(2*(dx^2+dy^2))

    p[1,:] .= 0
    p[ny,:] .= 0
    p[:,1] .= 0
    p[:,nx] .= 0
end

function plot2D(x, y, p)
    fig = PyPlot.figure(figsize=(11,7), dpi=100)
    ss = PyPlot.surf(x,y,p, rstride=1, cstride=1, cmap=ColorMap("coolwarm"),
            linewidth=0)
    xlim(0,2)
    ylim(0,1)
    PyPlot.show()
end

plot2D(x, y, p)
本篇文章来源于微信公众号: CFD之道


评论前必须登录!
注册